31.9.35 UpSet Plot

Contents
Data Requirements
Select one delimited set-membership column, or two or more categorical or binary columns to create an Upset plot
Creating the Graph
Select required data.
From the menu, select Plot > Categorical: UpSet Plot to open the plot_upset dialog
The plot_upset Dialog Box
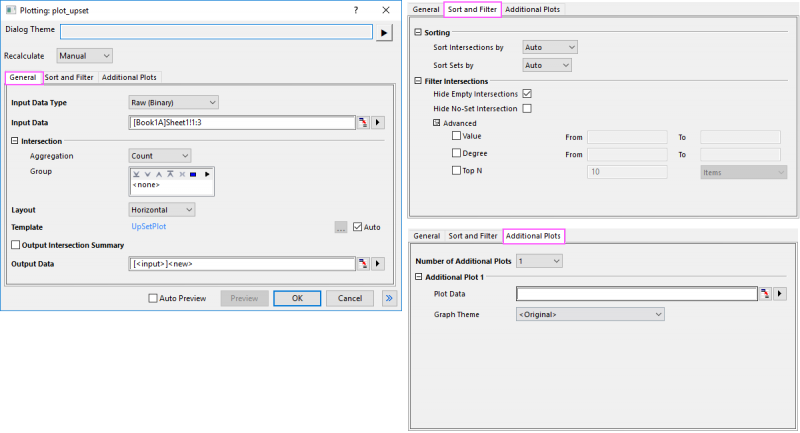
General tab
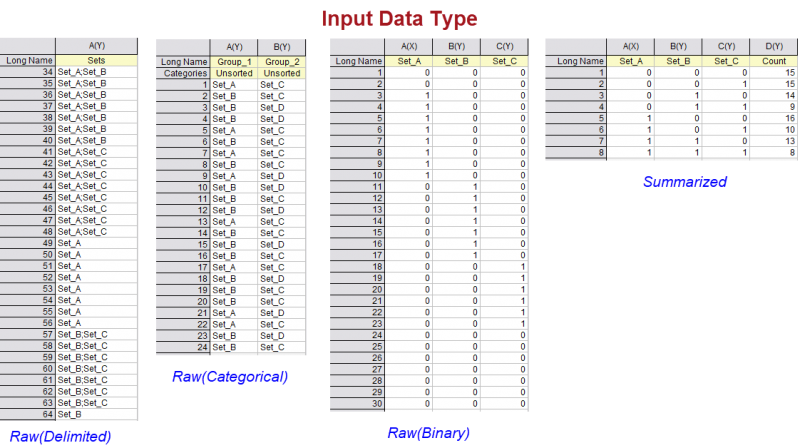
| Input Data Type | Select the input data type to plot the UpSet plot:
|
|---|---|
| Input Data | Select the input data according to the data type you chosen. |
| Delimiter | When you chose Raw(Delimited) for Input Data Type, you can select a delimiter to seperate the sets. |
| Intersection | Specify how to aggregate the intersection data and whether subgroup the data.
|
| Layout | Specify how to arrange the column/bar charts and dot plot. |
| Template | By default, the built-in template has been selected, you can uncheck Auto to choose a user-defiend template. |
| Output Intersection Summary | Specify whether output the intersection summary data into a new sheet. |
| Output Data | Specify where the output data be output. |
Sort and Filter tab
| Sort Intersections by | Specify how to sort the intersections. By default, Auto is selected. If Auto is un selected, you can choose how to order the intersections, ascending or descending. |
|---|---|
| Sort Sets by | Specify how to sort the sets. By default, Auto is selected. If Auto is un selected, you can choose how to order the sets, ascending or descending. |
| Hide Empty Intersections | Hide zero-count combinations from your aggregated data.
Here, an empty intersection refers to an intersection with no members. However, an intersection with members can also have a value of 0, for example, when the aggregation method is mean or sum. When Input Data Type = Summarized, the bar where the value is 0 won't be hidden, but the bar where the value is missing value will be hidden. |
| Hide No-Set Intersections | Specify whether show the items that belong to none of the displayed sets (degree 0). |
| Adcanced | You can use Value, Degree or/and Top N option to filter the intersections. |
Additional Plots tab
This tab is used to add additional panels to the UpSet plot—the attribute plots based on item metadata (such as histograms, box plots, or scatter plots).
| Number of Additional Plots | You can choose how many additional plots you want to add. The maximum is 2. |
|---|---|
| Additional Plot 1/2 | Select the plot data for additional plots and choose the plot type you desired. |
Template
UpSetPlot.OTPU(installed to the Origin program folder).
Notes
An UpSet plot is a visualization method used to display data involving more than three intersecting sets. UpSet visualizes intersections using a matrix: the rows correspond to the individual sets and the columns to the intersections between them (or vice versa), while the sizes of the sets and intersections are represented by bar charts.
Version Information
| Minimum Version: Origin 2027 |