31.18.14 Ternary Overlaid Contour Plot
Data Requirements
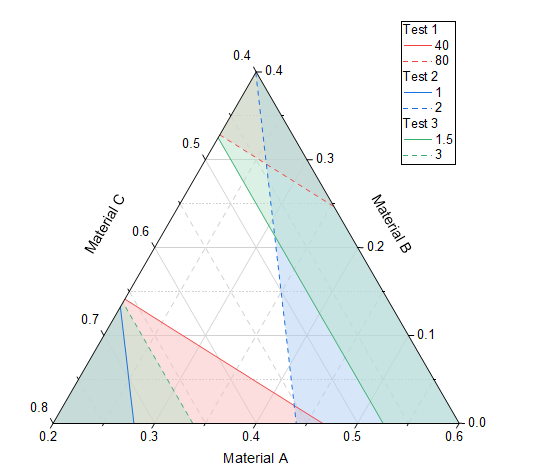
Select 1 or more sets of XYZZ columns to create overlaid contour plot in Ternary coordinate based on specified low and high thresholds.
Creating the Graph
Select required data.
From the menu, choose .
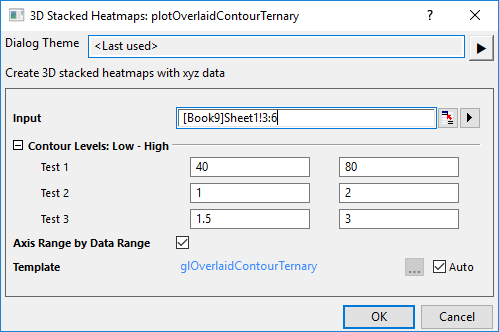
The selected response variables are listed in the dialog to let you specify the Low and High contour levels; Inside this range is feasible region, outside this range is nonfeasible region.
Axis Range by Data Range
Check this box to find suitable scale range for ternary, and set the scale. Regarding how Origin determines a suitable scale range, the process is as follows:
- Firstly, get minimum value from the first 3 columns(XYZ) of input,
- Follow the calculations below:
- Zmax=Total-(Xmin+Ymin) //Total is 100 or 1, base on X+Y+Z in original data or normalized data
- Ymax=Total-(Xmin+Zmin)
- Xmax=Total-(Ymin+Zmin)
- Finally, we get new XYZ range.
Template
glOverlaidContourTernary.OTPU (installed to the Origin program folder).
Notes
A Ternary Overlaid Contour plot can be recognized that an Overlaid Contour plot plotted onto a ternary coordinate: The first 3 columns XYZ(factors) decide the scale range of the ternary and then the other Z columns(responses) will be plotted as the regions.