Select one Z column (or a range from one Z column). If this Z column has an associated X and an associated Y column, then these X and Y columns are used; otherwise, the worksheet's default X and Y values are used.
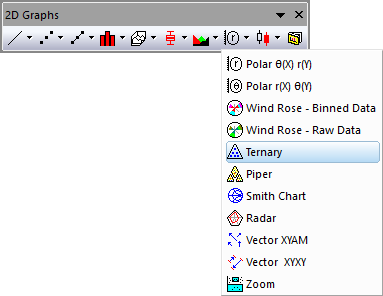
Ternary
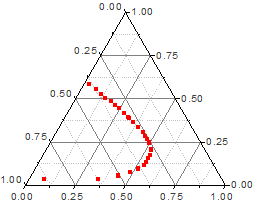
Line + Symbol Ternary and Line Ternary
TERNARY.OTP (installed to the Origin program folder).
From Origin 9.0, it is possible to change the axis direction of ternary plot. To do this, you need to:
Beginning with Origin 2021, you can control the Rescale mode of the graph axes:
Ternary plots assume that the input data is normalized, which means that the sum of the absolute values of cells in every row equals to 1 or 100: |x|+|y|+|z|=1 or 100. If the input data has at least one data point that is not normalized, a Reminder Message dialog box will come up to ask you whether to normalize your data before the ternary plot is created.
If you choose “Yes”, Origin will normalize the input data and replace the original data with the normalized data in the worksheet. And if you choose “No”, Origin will also normalize the input data and then plot, but the original data in the worksheet will not be changed. When you use Data Reader to read data from the ternary plot, you will read the data that is not normalized.
The normalization is performed with the following steps for each row:

You can zoom in on the scales and change them.