8.4.2.2 Axis Dialog for Ternary and Tetrahedral Graphs
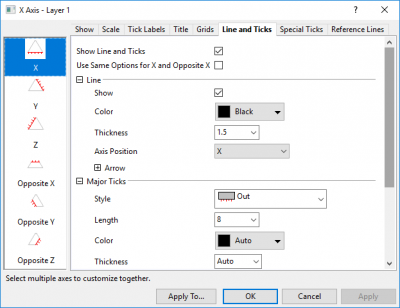
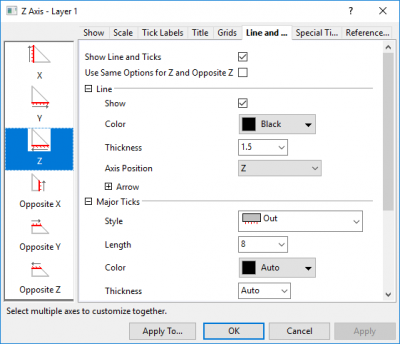
The Axis Dialog box for ternary and tetrahedral coordinates is a tree-view dialog with controls for X/Y/Z/Zh axes and tick mark customization. It is used for the axes in ternary graph, ternary contour, ternary part of piper chart, 3D ternary and 3D Tetrahedral(also called Quaternary Phase Diagrams). It is accessible by double clicking on the axis, or Format:Axes:... menu.
|
|
| Axis Dialog for 2D Ternary | Axis Dialog for Right-Triangle Ternary |
|
|
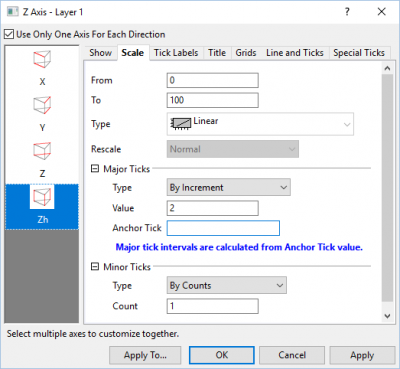
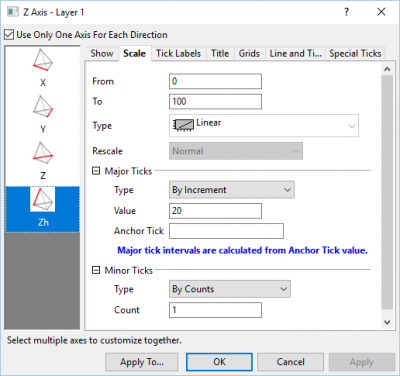
| Axis Dialog for 3D Ternary | Axis Dialog for 3D Tetrahedral |
Contents
Axis Dialog Tree Nodes
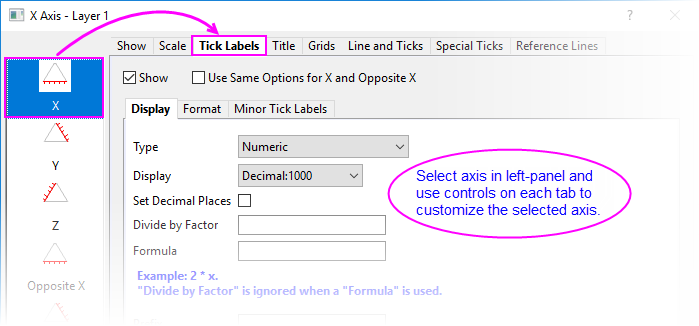
To navigate this tree node-based dialog, click an axis icon in the left panel to access the controls in the right panel.
Use Only One Axis For Each Direction (3D Ternary and 3D Tetrahedral)
In 3D Ternary graphs, if the Use Only One Axis For Each Direction check box is selected, by default, only the axes of the bottom XYZ plane are shown. If this is cleared, you can opt to show XYZ axes individually, in the top plane. The XYZ axes in the bottom XYZ plane are labeled "Bottom" in the left panel; those in the top XYZ plane are labeled as "Top."
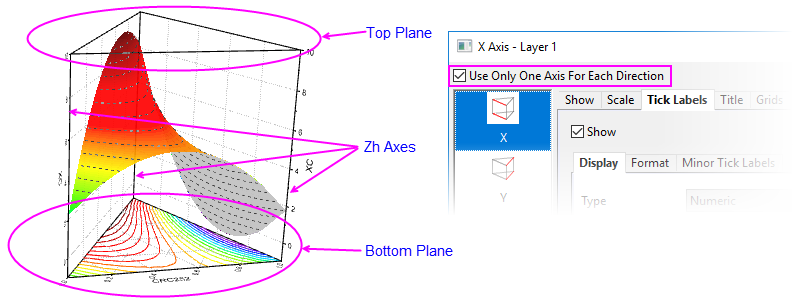
In 3D Tetrahedral graphs(also called "Quaternary Phase Diagrams"), if the Use Only One Axis For Each Direction check box is selected, only two bottom axes and one Zh axis are displayed. If this is cleared, the third bottom axis is shown. You can customize each axis individually.
Note that not all axes are displayed simultaneously even though they are turned on. Axis display is also related to the orientation of the graph layer. You may need to rotate the graph in order to display the other axes.
Show tab
2D Ternary, Ternary Contour and Right-Triangle Ternary
| Show X/Y/Z Axis | Check or clear this box to show or hide the axis. For a Right-Triangle Ternary, the Z axis is hidden by default. If you turn it on, it will lay on the Y axis but has opposite scale direction from Y axis. |
|---|---|
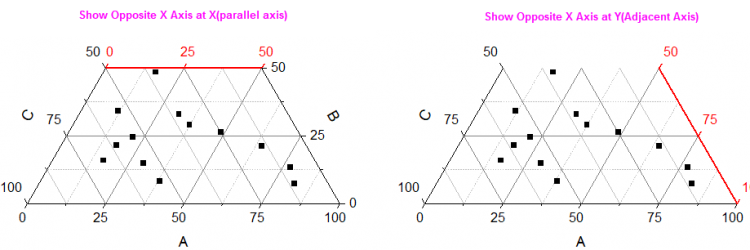
| Show Opposite X/Y/Z Axis | By default, a 2D Ternary plot will have three primary axes which will be set to the full scale range (either 0 - 1 or 0 - 100). In the left panel of the Axis dialog box, you may also see that there are three "Opposite" axes that in most cases, will not be useful and are not enabled.
By limiting Scale tab From and To values, you can create a 2D ternary plot that uses only a portion of the full axis scale ranges of the primary axes and then, the "Opposite" axes may be needed. For instance, by limiting the scale ranges of all three primary axes, you can create a rhombus-shaped graph in which axes are opposite one another. For information, see this OriginLab blog post. |
| Opposite Axis Show at | Specify where to show the opposite axis. You can choose place the opposite axis on the parallel axis or next axis.
You also can the LabTalk Command layer.Axis.adj=0/1 to switch the position of the opposite axis. For example, when you run |
3D Ternary and 3D Tetrahedral
| Show Axis | Bottom (default), Top or None. |
|---|---|
| Orientation | Controls orientation of tick labels, axis titles and tick marks. The default is Follow Layer Setting. You can modify orientation for each axis here in the Axis dialog box or you can go to the Plot Details Axis tab (layer level) and change orientation of labels/ticks/titles for all axes in the layer. |
Scale tab
All ternary-type plots support only linear axis scales.
| From |
Set the initial scale value in this text box. |
|---|---|
| To |
Set the final scale value in this text box. |
| Type |
In ternary coordinates, only linear type axis scales are supported and this control is unavailable (read-only). |
| Rescale |
Additional information on these axis rescale modes can be found here. |
| Major Ticks |
Specify the type, value and the first tick of the major ticks (as per the section for Major Ticks in this page). |
| Minor Tick |
Specify major tick type (as per the section for Minor Ticks in this page ). |
Tick Labels tab
The Tick Labels tab and its sub-tabs are used to control the axis tick labels. In the ternary plot, there are three sub-tabs for Tick Labels -- Display, Format, and Minor Tick Labels.
- Check or clear the Show box to enable or disable Tick Labels for the selected axis/axes.
- For 2D Ternary and Ternary Contour plots: A Use Same Options for X/Y/Z and Opposite X/Y/Z box (cleared by default) forces the Opposite axis to use the same tick label options as the primary axis. Note that each primary axis has a Use Same Options... box.
- For 3D Ternary and Tetrahedral plots: Clearing the Use Only One Axis For Each Direction will show the Use Same Options for X/Y/Z and Opposite X/Y/Z box. Checking the box forces the secondary axes to use the same tick label options as the primary axis.
| Display | For help with Display tab controls, see this page. |
|---|---|
| Format | For help with Format tab controls, see this page. |
| Minor Tick Labels | For help with Minor Tick Labels tab controls, see this page. |
Title tab
For help with axis Title tab controls, see this page.
Grids tab
for help with axis Grids tab controls, see this page.
Line and Ticks tab
For help with the axis Line and Ticks tab controls, see this page.
Special Ticks tab
For help with Special Ticks tab controls, see this page.
Reference Lines tab
This tab is available for 2D Ternary and Ternary Contour plots only.
As with axes in Cartesian coordinates, you can add reference lines on all three axes of a 2D Ternary or Ternary Contour plot. Reference lines will show within the triangular frame as a straight line parallels to the adjacent axis, counting in a clockwise direction.
For help with Reference Lines tab controls, see this page.