29.9.37 Symmetry Plot
Symmetry-Plot

Data Requirements
Select at least one column to create symmetry plot.
Creating the Graph
Select required data.
From the menu, select Plot > Statistical: Symmetry Plot
Template
Symmetry.OTPU(installed to the Origin program folder).
Notes
Symmetry Plot can be used to determine whether the response data is symmetrically distributed.
To create a symmetry plot, Origin will
- sort your data in ascending order;
- calculate the median value of dataset;
- draw a scatter plot with the upper distance of the median on the X axis against the lower distance to the median on the Y axis;
- add a reference line Y=X to represent a perfectly symmetric sample;
- create a histogram plot to show the shape of distribution, with a reference line at median value.
Two result sheets will be created, which contain the plot data and result graph(s):
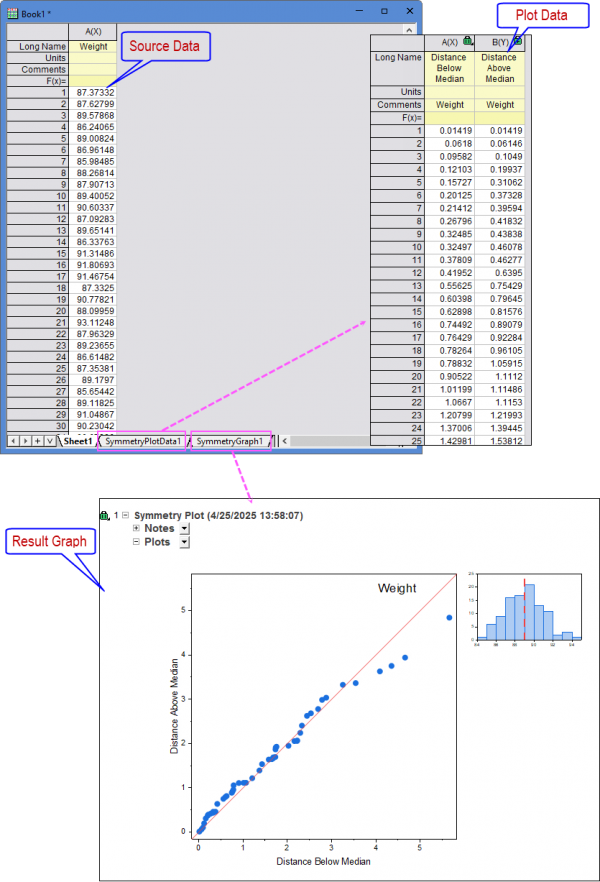
- As you can see in the result graph, the points are lying along the line Y=x and the histogram has an approximately symmetrical peak-shaped curve. Therefore, we can conclude that the response data is symmetric with respect to its median and has a a symmetric distribution.
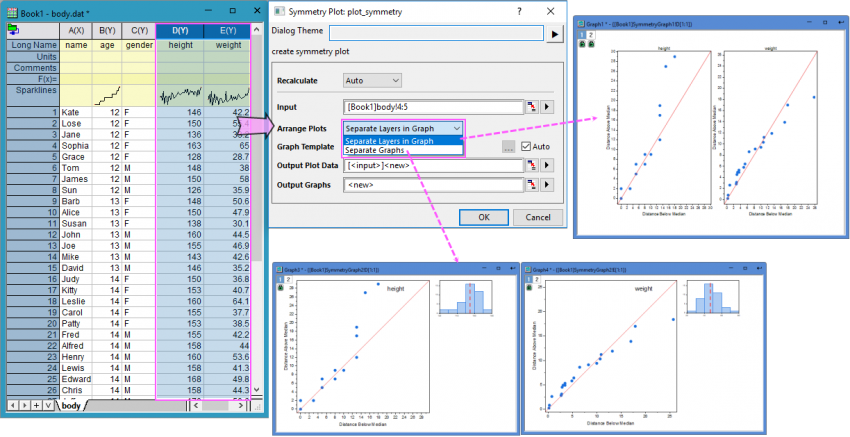
When you selected multiple response columns as Input, choosing the plot menu will open the plot_symmetry dialog which allows you to specify how to arrange the plots: Seperate Layers in Graph or Seperate Graphs.
Version Information
| Minimum Version: Origin 2025b
|