The 2D Integration Gadget tool (uses the addtool_integ2 X-Function) allows you to calculate the 2D integration for a contour or image graph created from uniformly spaced matrix or non-uniformly spaced virtual matrix or XYZ worksheet data.
To use this gadget tool, create a contour plot from your data, activate the graph and select Gadgets:2D Integrate from top menu.
| Notes: The options for the X-Function of gadget is organized as tree variable, the tree node names to be called for each options/branches are listed in the bracket next to the option name(tree node labels). |
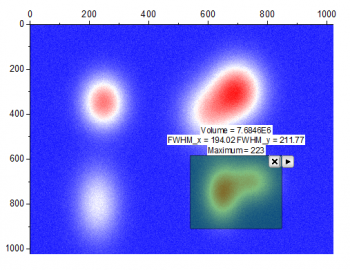
The ROI (region of interest) box defines the area for surface integration calculation.
Define the shape of ROI box.
| Rectangle | Specify the shape and postion of the rectangle ROI in Shape Postion below. |
|---|---|
| Circle | Specify the shape and postion of the circle ROI in Shape Position below. |
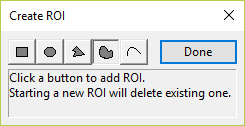
| Arbitray Shape | After clicking OK button, a Create ROI mini dialog box will open, allowing you to choose the drawing tool to draw arbitrary shape on the graph to add ROI box.
|
Note:After adding a ROI to the graph, you can always click the triangle button at the top-right corner of the ROI box and select Modify ROI menu to open the Create ROI dialog to change the ROI shape again.
You can define the position of ROI box by giving values for XY coordinates.
| X1 (xFrom) | Enter a value for the X coordinate for the leftmost line in the ROI box. |
|---|---|
| X2 (xTo) | Enter a value for the X coordinate for the rightmost line in the ROI box. |
| Y1 (yFrom) | Enter a value for the Y coordinate for the bottom line in the ROI box. |
| Y2 (yTo) | Enter a value for the Y coordinate for the top line in the ROI box. |
| Fixed(Prevent moving by ROI) (fix_roi_loc) | Specify whether to prevent manually moving the ROI box. |
Specify whether to show a tool name at the top left corner of the ROI box. The tool name can be further specified in the text box if this check box is selected.
Specify whether to show the results of corresponding quantity on center top of the ROI box.
| Volume (topVolume) | The volume integrated from base to the source surface. |
|---|---|
| FWHM (topFwhm) | The full width at half the height of the source surface. |
| N (topN) | The number of data points. |
| Minimum (topMinimum) | The minimum Z value. |
| Maximum (topMaximum) | The maximum Z value. |
| Mean (topMean) | The mean of Z values. |
| Median (topMedian) | The median of Z values. |
| SD (topSD) | The standard deviation of all Z values. |
| Sum (topSum) | The sum of Z values. |
Specify the fill color for the ROI box.
| Mode (method) | Select a mode for the base.
|
|---|---|
| Constant (constantMode) | This is only available when the Mode is set to Constant. It is used to specify the Z value for the baseline plane.
|
| Z= (zvalue) | This is only available when Constant is set to Custom. It is used to specify a custom Z value for baseline plane. |
| Boundary Tolerance (%) (boundtor) | This is only available when Mode is set to Plane. The boundary is determined by the option selected for Range. The tolerance in percentage decides a tolerance width or height. The points whose distance from the boundary is less than the tolerance width or height. Tolerance width/height = Tolerance (%) * Width/Height. |
| Range (range) | This is not available when the Mode is set to None or Custom is selected for the Constant drop-down menu. It is used to specify the data range considered when determining base plane.
|
You can specify options for integration in this tab.
If Interpolate for Missing Values (interpmissing) is checked, the interpolation will also taken consideration the missing values.
If Show Baseline-Subtracted Surface (showsurface) is checked, the subtracted surface (subtracted from source data and baseline plane) will be shown.
Customize the output results.
| Script Window (script) | Specify whether to output the results to the Script window. |
|---|---|
| Results Log (reslog) | Specify whether to output the result to the Results Log. |
| Append to Worksheet (appendwks) | Specify whether to append the results to a worksheet. |
| Result Worksheet Name (wbkName) | This is only available when Append to Worksheet (appendwks) is selected.
If you choose to send output to a Worksheet, you have these options:
|
Specify the quantities to be outputted.
| Dataset Identifier (name) | Specify a dataset identifier in the drop-down list. |
|---|---|
| Index Range (index_rng) | Specify whether to output the indices for the dimension limited by the ROI box. This is only available when the input data is not XYZ range. |
| X Range (x_rng) | Specify whether to output the indices for X range. |
| Y Range (y_rng) | Specify whether to output the indices for Y range. |
| Max Height (max_height) | Specify whether to output the maximum height from source surface to baseline. |
| Volume (volume) | Specify whether to output The volume integrated from base to the source surface. |
| Area of Surface (area) | Specify whether to output the area of the source surface. |
| Centroid (centroid) | Specify whether to output the coordinate of centroid for the selected region. |
| FWHM (fwhm) | Specify whether to output the full width at half the height of the source surface. |
| Half Width (half_width) | Specify whether to output the half width. |
| Z Max (zmax) | Specify whether to output the maximum value of Z. |
| Index at ZMax (index_zmax) | Specify whether to output the column/row index for the data point at maximum Z value. |
| (x,y) at ZMax (xy_zmax) | Specify whether to output the X and Y values for the data point at maximum Z value. |
| Statistics (QStatistics) | Specify whether to output the statistic results based on Z values, available quantities are:
|
| Baseline (baseline) | Specify whether to output the baseline information. |
|---|---|
| Output To (OutputTo) | Specify where to output the result . |
| Notes: The name in the brackets is the tree node name, and the name outside is the tree node label. When an X-function executes by script, you have to assign values to tree nodes using their names. Special characters and spaces are not allowed in tree node names. However, you can use special characters and white space in the tree node label. |
Click the triangle button ![]() near the top right corner of the ROI to open a fly-out menu that offers the following options:
near the top right corner of the ROI to open a fly-out menu that offers the following options:
| New Output | Output the result. |
|---|---|
| Go to Report Worksheet | Go to the result worksheet once the result has been output to worksheet. |
| Output to Clipboard | When selected (menu item checked) New Output will be placed on the Clipboard. |
| Change Data | Change the input data.
|
| Expand to Full Plot(s) Range | Expand the ROI box to the full Plots range. |
| Expand to Full Layer Width | Expand the ROI box to the full layer width. |
| Expand to Full Layer Height | Expand the ROI box to the full layer height. |
| Save Theme | Save the settings in this dialog as a dialog theme. |
| Save as <default> | Save the setting in this dialog as <default> theme. |
| Load Theme | Load the dialog theme pre-saved. |
| Preferences | Open the Preferences dialog. |