16.18 Subtract Straight Line
Description
This tool can be used to subtract a straight line from a data set. The straight line is determined by two points. If a graph window is active, you can use this tool from the menu.
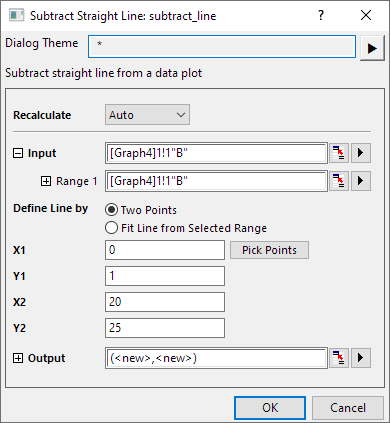
To subtract straight line
- When a graph window is active, select Analysis: Mathematics: Subtract Straight Line
or
- When a worksheet is active, run subtract_line -d; in the Script Window to open the dialog.
Dialog Options
| Recalculate |
Controls recalculation of analysis results
For more information, see: Recalculating Analysis Results |
|---|---|
| Input |
Specifies the XY data range or curve that will be subtracted. For help with range controls, see: Specifying Your Input Data |
| Define Line By |
Select the method for defining the straight line:
|
| Output |
Specify the output data range. The output curve will be added in the graph. For help with the range controls, see: Output Results. |