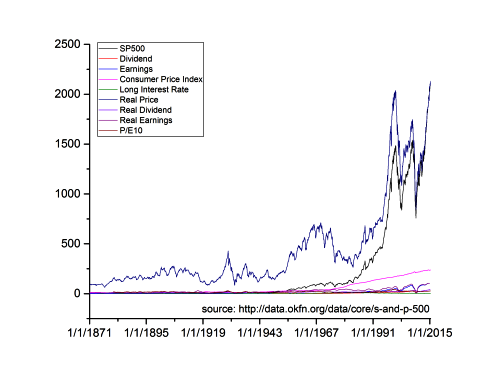
31.14.6 Line (Stock)
Data Requirements
Select one or more Y columns (or a range of one or more Y columns). If there is an associated X column, X column supplies X values; otherwise, sampling interval of the Y column or row number is used.
Creating the Graph
Select desired data.
Select
or
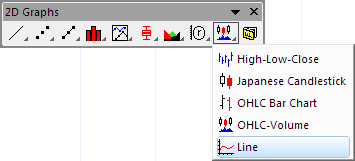
Click the Line button (stock chart group) on the 2D Graphs toolbar.
Template
StockLine.otp (installed to the Origin program folder).
Notes
The (stock) Line graph template is slightly customized for plotting financial data:
- The axis Scale Type is set to Discrete to exclude non-trading dates.
- The Rescale Margin(%) is set to 0.