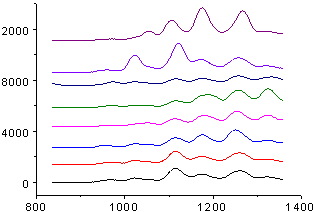
29.1.4 Stacked Lines by Y Offsets Graph
StackLineYOffset-Graph
Data Requirements
Select at least one Y column (or a range from at least one Y column). Ideally, select at least two Y columns (or a range of at least two Y columns). If there is an associated X column, X column supplies X values; otherwise, sampling interval of the Y column or row number is used.
Creating the Graph
Select required data.
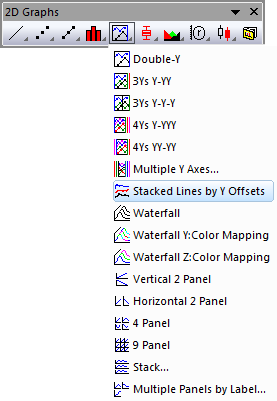
Select .
or
Click the Stacked Lines by Y Offsets button on the 2D Graphs toolbar.
Template
OFFSETSTACKY.OTP (installed to the Origin program folder).
Notes
- By default, Stacked Lines by Y Offsets graphs employ the Individual data plot offset type. Each data plot is assigned an individual offset setting that can be modified in the Plot Details dialog box.
- The distances between each curve can be adjusted using this offset feature to eliminate the need to change the original data. Using this feature prevents the curves from overlapping and ensures that each curve can be viewed clearly.
- The graph can be adapted to plotting of subgroups of datasets. See this discussion on the Plot Details Stack tab.
- If there is a binary Y column in the source dataset, the binary column curve will be scaled to make all stacked curvs on same scale. Origin will find the Y value ranges for all plots that are not binary, and use the average of these ranges to scale the binary column data.
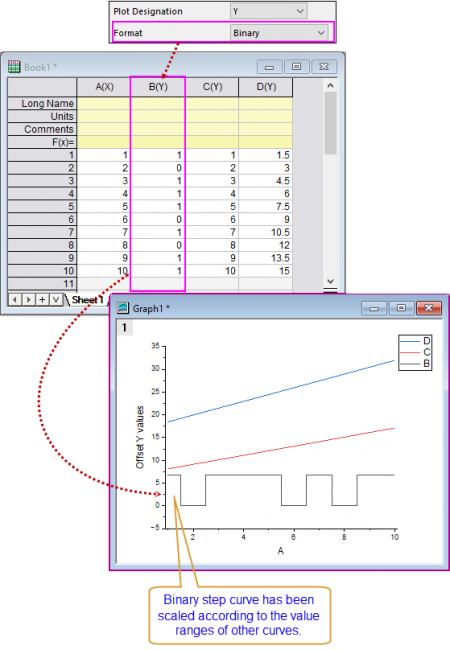
- Note: The system variable @SBD is also used to control the binary step height, default is 60 which means 60% of the average Y range of other non-binary plots.