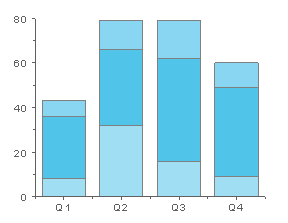
31.4.4 Stacked Column Graph
Data Requirements
Select at least one Y column of values (or a range from at least one column). If there is an associated X column, X column supplies X values; otherwise, sampling interval of the Y column or row number is used.
Creating the Graph
Select required data.
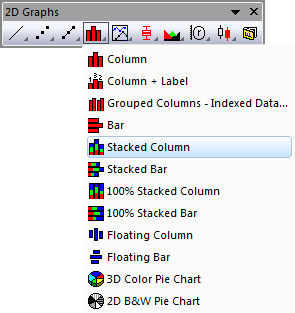
From the menu, select .
or
Click the Stacked Column button on the 2D Graphs toolbar.
Template
COLUMN.OTP (installed to the Origin program folder).
Notes
- For each X value, the associated Y values are represented as the height of a column. Each column has a fixed width. The columns, however, are stacked vertically on each other so that the second column begins at the end of the first column, etc. The stack of columns is centered at the associated X value. To unstack the columns, select .
- To display a line where Y=0, select the Bar Graph Show Zero Values check box on the Graph tab of the Options dialog box ().
- Grouped Stacked column graphs can be constructed by specifying group Size, or by using worksheet Column Label row data. For more information, see the Subgrouping section of the Plot Details Group tab controls.