Select one or more Y columns or a range of data from at least one Y column. If there is an associated X column, X column supplies X values; otherwise, sampling interval of the Y column or row number is used.
Select required data.
From the menu, select .
or
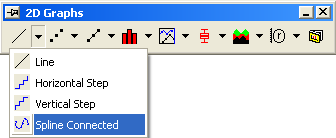
Click the Spline button on the 2D Graphs toolbar.
LINESYMB.OTP (installed to the Origin program folder).
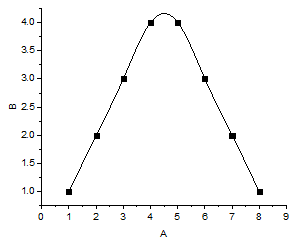
Each data point in the data plot is connected by a line. The line connection type is set to Spline on the Line tab of the Plot Details dialog box (). The data points are displayed as symbols.