31.9.23 Scatter Matrix Graph
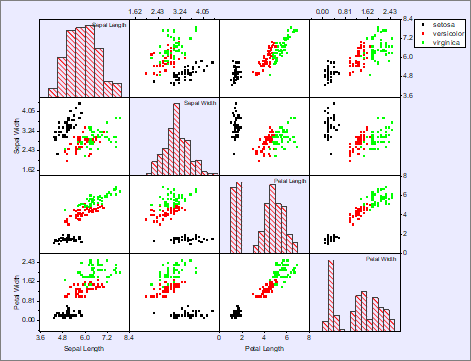
A scatter matrix is a pair-wise scatter plot of several variables presented in a matrix format. It can be used to determine whether the variables are correlated and whether the correlation is positive or negative.
Data Requirements
At least two worksheet columns(or a range from at least two columns).
Creating the Graph
To create a Scatter Matrix:
- Highlight at least two worksheet columns(or a range from at least two columns).
- Select .
- or
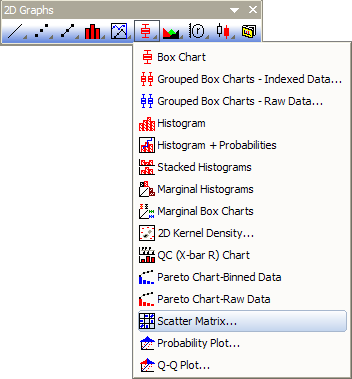
- Click the Scatter Matrix button on the 2D Graphs toolbar.
Each selected column or range is plotted against every other selected column or range as a Scatter graph. All layers are presented as a matrix in a graph.
Template
BOXMATRIX.OTP (installed to the Origin program folder)
Notes
- Selecting N datasets or ranges will result in N^2-N graphs and an even larger number of datasets. Selecting a large number of datasets or ranges may increase computation times dramatically and produce increasingly smaller graphs.
- The Scatter Matrix is created using the plot_matrix dialog box. For information on creating and customizing the Scatter Matrix, see Scatter Matrices.
- When creating or modifying the scatter matrix, you have the option of performing a linear fit and outputting adjusted R-square and/or Pearson's r statistics to a new worksheet named as ScatterMatrixStatsN. Additionally, statistics are pasted as text labels, to each plot in the scatter matrix. For information, see Scatter Matrices.