31.9.28 Sankey Diagrams
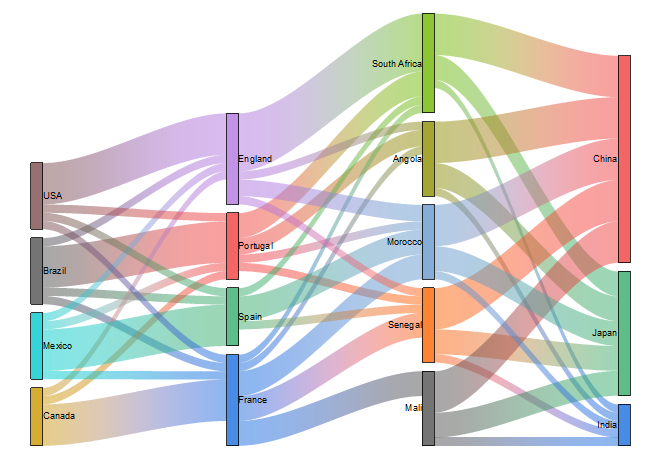
Data Requirements
Select at least two columns of values or a range of values from at least two columns. Plot designation does not matter; selected columns will be treated as Y columns.
Creating the Graph
- Select required data.
- Select Plot > Categorical: Sankey.
For information on the customizing allivial diagrams, see these topics:
- The (Plot Details) Node tab
- The (Plot Details) Link tab
- The (Plot Details) Label tab (Sankey/Alluvial/Network)
Template
Sankey.otpu (installed to the EXE folder of Origin)
Notes
Sankey diagram is another kind of alluvial diagram, which also has rectangles for "nodes", colored areas(linking "nodes") for "links", vertical groups of nodes for "steps".
The difference is that the source data of Sankey diagram are raw data, the node values of which haven't been arranged as multiple columns for the steps. Two kinds of raw data can be selected and plotted,
- One includes four columns -- index value of source link, index value of target link, link values and nodes label. Some formatted JSON files have such data structure.
- One includes three columns -- label of source link, label of target link and link values.
Further Customization:
- You are allowed to adjust the gap between nodes and the gap between the node and flow link for all plots together.
- Click on any node, the whole flows input or output this node will be highlighted including the links and the involved nodes.
- Click on any link set, the whole flows from the start to the end will be highlighted including the links and the the involved nodes.
- You are allowed to set the link color, to follow the nodes or use the color chooser.
- You can decide whether and how to show arrows for nodes and/or links.
- You can decide whether and how to show labels for nodes and/or links.