
Select at least one column to create run chart. For multiple columns, each row is one subgroup.
Select required data.
From the menu, select Plot > Statistical: Run Chart to open the plot_runchart dialog.
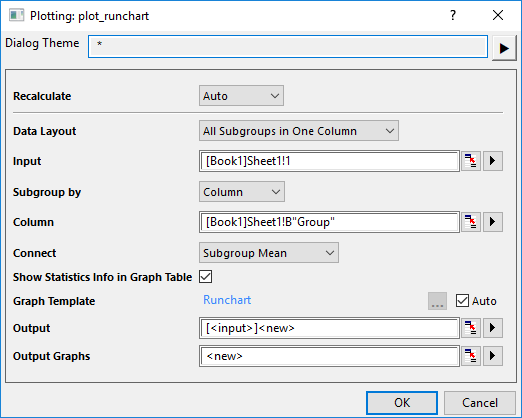
| Data Layout | Choose the data layout according to the data arrangement.
|
| Input | Select the input data.
|
| Subgroup by | This control is only avaliable for All Subgroups in One Column layout. Choose how to subgroup the input column(s), by sample size or values in specified reference column. |
| Size | This control is only avaliable for All Subgroups in One Column layout and Subgroup by = Size. Specify the row number to subgroup the data. |
| Subgroup Label | This control is only avaliable for All Subgroups in One Column layout and Subgroup by = Size'. Specify a column to label the subgroups. |
| Column | This control is only avaliable for All Subgroups in One Column layout and Subgroup by = Column. Specify the reference column to subgroup the input data. |
| Connect | Connect Mean values or Median values of subgroups. |
| Show Statistics Info in Graph Table | Specify whether to show the statistics results as a table on the graph. |
| Graph Template | Specify the template to plot the run chart.
By default, the built-in template Runchart is used; you can uncheck Auto check box to browse and select a user template, to apply the format you saved in advance. |
| Output | Output the plot data to specified sheet. |
| Output Graphs | Output the result graph(s) to specified sheet. |
Runchart.OTPU(installed to the Origin program folder).
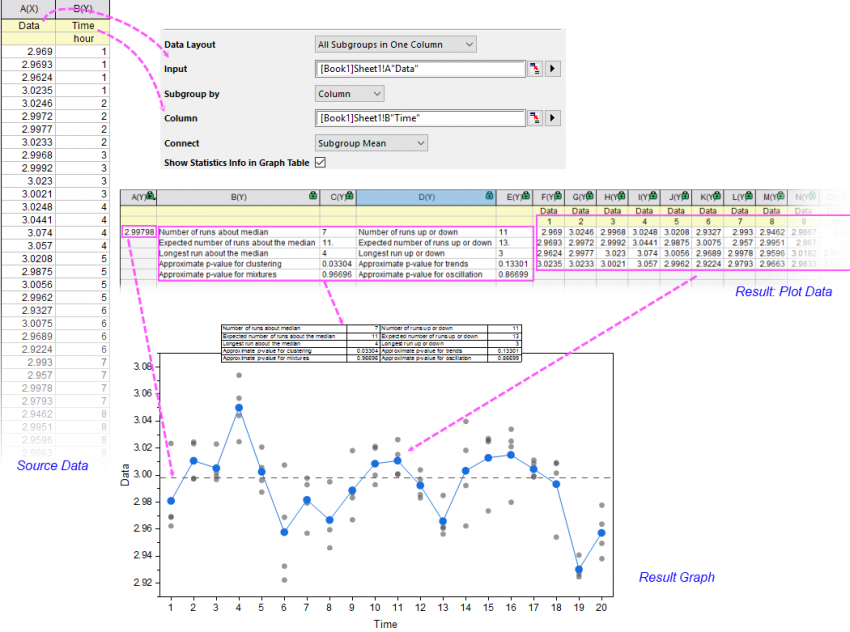
A Run Chart, also known as a run-sequence plot, is used to study collected data for trends or patterns over a specific period of time or an ongoing process. You can use it to monitor data over time to detect trends, shifts, or cycles, to analyze evidence of special-cause variation in your process.
Origin's Run Chart plots the collected data by specified subgroups; each subgroup contains the observed data from the same time. All observed data will be plotted as vertically arranged dots by subgroups, and the mean or median of each subgroup will be plotted as Line+Scatter plot against the time series. A horizontal dash line at mean or median of whole input data will be added as the reference line.
| Minimum Version: Origin 2025b |