31.3.6 Row Wise Graph
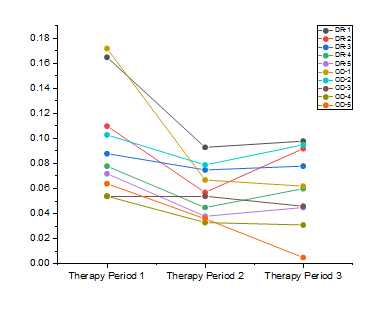
Data Requirements
Select two or more Y columns or a range of data from at least two Y columns.
Creating the Graph
Select required data.
From the menu, select .
or
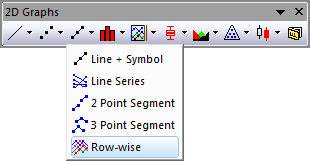
Click the Row-Wise button on the 2D Graphs toolbar.
You can refer to the section below for the detailed dialog controls:
The plot_rowwise Dialog Box
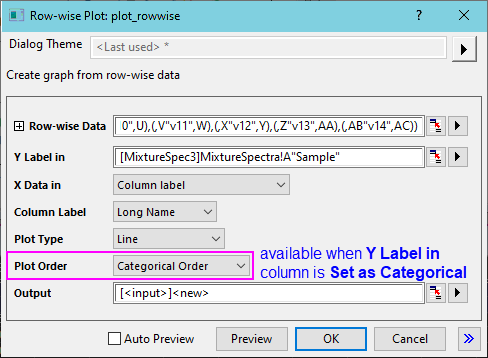
| Rowwise Data | This branch is used to specify the input data. |
|---|---|
| Y Label in | Specify a column as plot legend. |
| X Data in | Specify X axis value for the graph. The available options are as below:
|
| Column label | Available when X Data in=Column label. Specify Long Name, Unit or Comments as X data. |
| X Row Range | Available when X Data in=Custom. Specify a row range as X data. |
| Plot Type | Specify plot type to Line, Scatter, Line+Symbol, Column or Bar. |
| Plot Order | When the selected column for Y Label in is Set as Categorical, this control is available. The default is Categorical Order. Data Row Order is optional. This becomes important when, for instance, the legend lists categories and the user wants legend entries to appear in a particular order. |
| Output | Specify where to output the calculated data. |
Template
rowwise.otpu (installed to the Origin program folder).