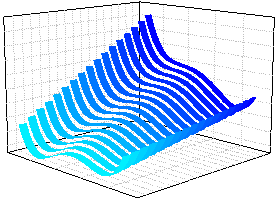
31.15.6 3D Ribbons Graph
Data Requirements
Select at least one Y column (or a range from at least one Y column). Ideally, select at least two Y columns (or a range of at least two Y columns). If there is an associated X column, X column supplies X values; otherwise, sampling interval of the Y column or row number is used.
Creating the Graph
Select required data.
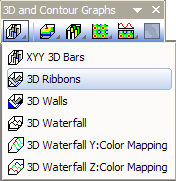
From the menu, choose .
or
Click the 3D Ribbons button on the 3D and Contour Graphs toolbar.
Template
- glRibbon.OTP (OpenGL)
- RIBBON.OTP
(Installed to the Origin program folder).
Notes
The Y value of each data point is represented as the height of a ribbon. Each ribbon has a fixed width, and is labeled with its worksheet column name on the Z axis.