31.13.13 Radar Chart (Spider Plot)
![]() See more related video:Radar/Spider Chart
See more related video:Radar/Spider Chart

Data Requirements
Select at least one Y column (or a range from at least one Y column). The X column displays as the title of the radial axis around the chart. If there is an associated X column, X column supplies X values; otherwise, sampling interval of the Y column or row number is used.
Creating the Graph
Select required data.
- Line + Symbol Radar
- From the menu, choose .
- or
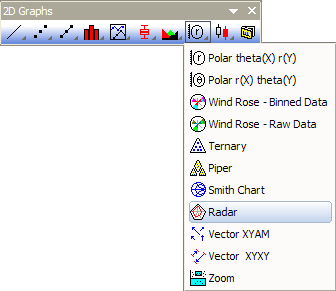
- Click the Radar button on the 2D Graphs toolbar.
- Line Fill Radar: From menu, choose .
- Line Radar: From menu, choose .
- Symbol Radar: From menu, choose .
Template
Radar.OTP (installed to the Origin program folder).