Select at least one column to create Q-Q plot. Select multiple data and group column(s) to compare distribution of different data/groups.
Select the required data.
Select
Or
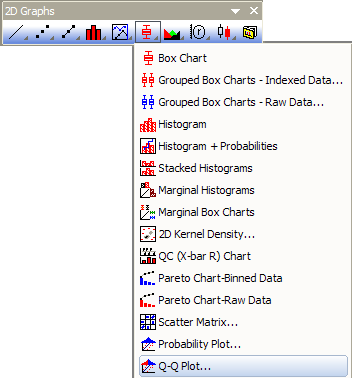
Click the Q-Q Plot... button on the 2D Graphs toolbar.
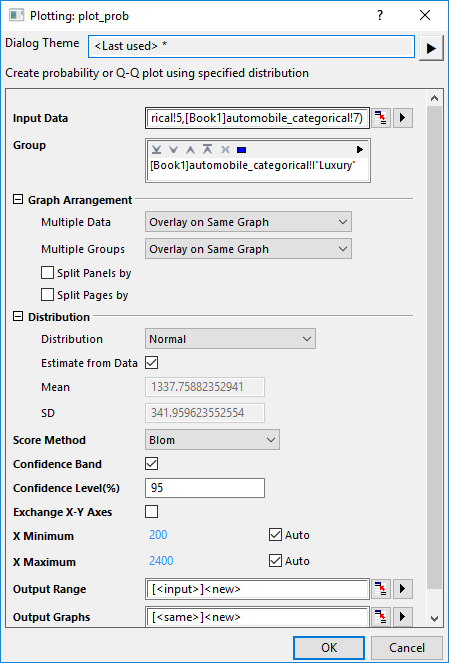
Origin opens the plot_prob dialog box.
Please see more details on creating and customizing the Q-Q Plot.
gQQ.optu
(installed to the Origin program folder).
For information about the calculation for Q-Q Plots, please refer to Probability Plot and Q-Q Plot.