29.4.1 QPCR
Contents
Support Information
To Analyze qPCR Assays
- Using a template
- Select menu Help: Startup Dialog to open the Startup dialog
- Go to the Lab Assays tab, expand the qPCR branch, and choose the desired data structure. A template will open with guidance.
- Using your own worksheet
- Enter your data in a worksheet,
- Select menu Statistics: Lab Assays: qPCR to open the analysis dialog
qPCR Data Structure
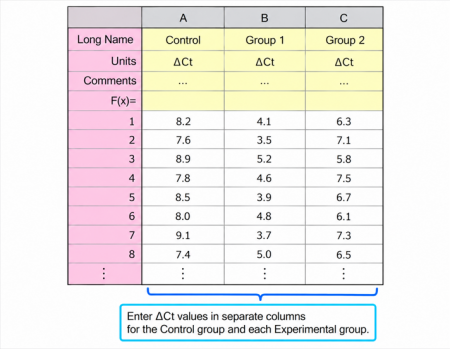
qPCR with ΔCt value
Analyze qPCR data and calculate relative gene expression (fold change) using ΔCt values.
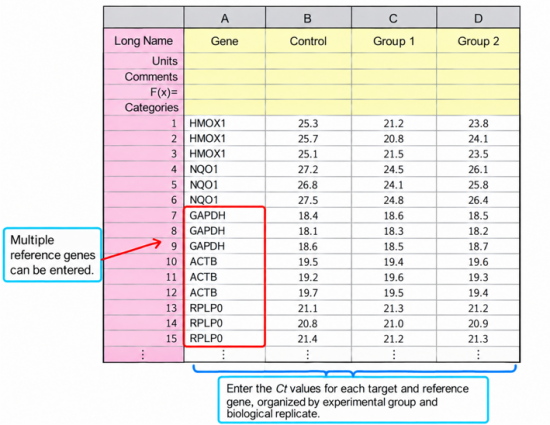
qPCR with Reference Gene
Analyze qPCR data and calculate relative gene expression (fold change) using target and reference gene Ct values.
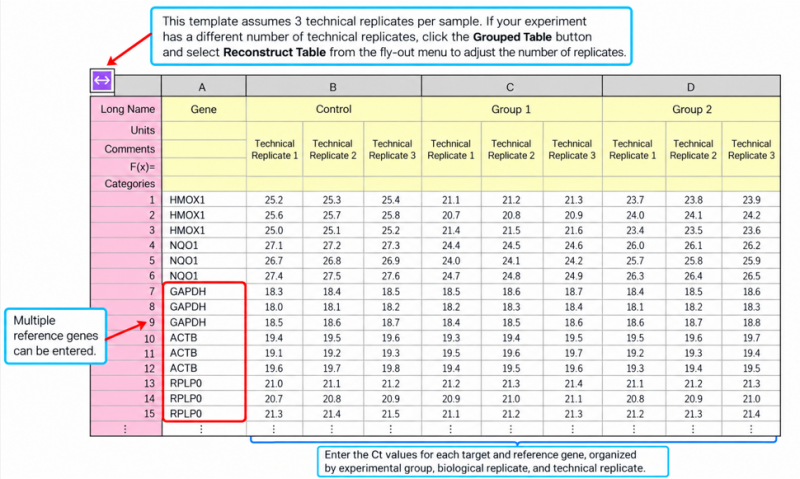
qPCR with Reference Gene and Technical Replicates
Analyze qPCR data and calculate relative gene expression (fold change) using target and reference gene Ct values, with technical replicates.
The qPCR Dialog Box
Input
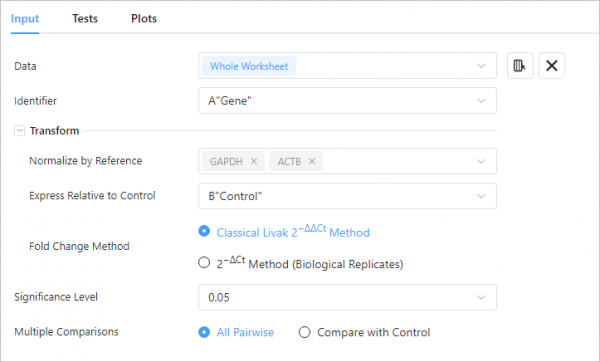
| Data | The ΔCt values to be analyzed |
|---|---|
| Identifier | Available for the "reference gene" and "reference Gene & technical replicates" workflow.
Select one gene as reference. |
| Normalize by Reference | Available for the "reference gene" and "reference Gene & technical replicates" workflow.
The housekeeping gene(s) used to correct for differences in sample amount and RNA quality. Each sample's ΔCt is computed against the geometric mean of the references selected |
| Express Relative to Control | Select a control/reference group which serves as the baseline (fold change = 1). All other groups will be expressed relative to this group. |
| Fold Change Method |
|
| Significance Level | Set the threshold to judge statistical significance, e.g., 0.05. Results with p < the threshold are considered statistically significant. |
| Multiple Comparisons | Choose the comparison set.
|
Tests
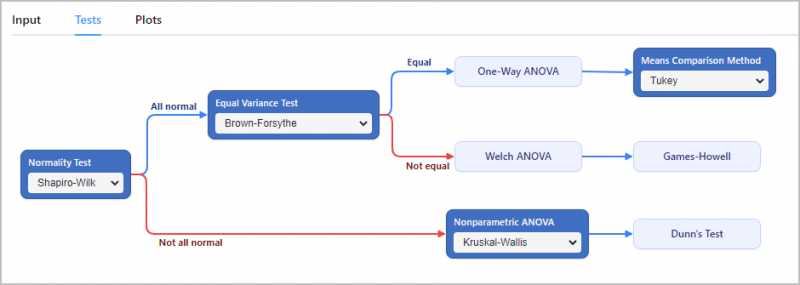
This tab controls which statistical test the analysis applies to your fold-change data. Instead of a single dropdown, it shows a decision-tree flowchart: the software runs a sequence of assumption checks on your data and automatically selects the appropriate test.
Step 1: Normality Test
Checks whether the expression values within each group follow a normal distribution.Select from the options below
 |
|
Step 2: Equal Variance Test (parametric branch only)
Tests whether the groups have equal variances (homoscedasticity). Select from the options below
- Bonnet Multiple Comparison
- Brown-Forsythe
- Levene ||
- Levene ()2
- Bartlett
|
|
Step 3: Nonparametric branch
Select a method below to compare group median via ranks. Followed by Dunn's Test for multiple comparisons
Plots
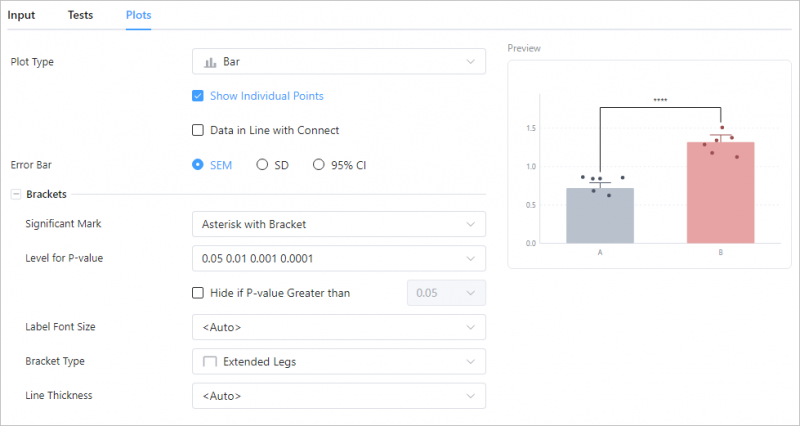
Controls the appearance of the mulitple comparison plot. Every change is reflected in the live preview panel on the right.