31.9.20 QC(x bar R) Chart Graph
Data Requirements
Select at least one column of values or a range from at least one column.
Creating the Graph
Highlight required data.
- Select
- Or
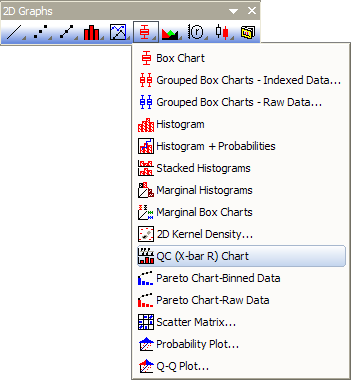
- Click the QC (X bar R) Chart button on the 2D Graphs toolbar.
Origin opens the X bar R Chart dialog box.
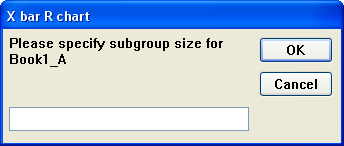
- Specify the subgroup size for the selected data set.
Origin creates a worksheet and graph window displaying two layers. The worksheet contains the mean, range, and standard deviation for each subgroup in the selected data set.
Template
Xbarr.OTP (installed to the Origin program folder)
Notes
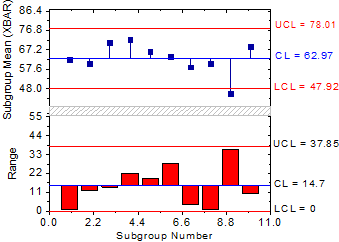
The upper layer of the QC chart is the X bar graph. This layer displays the mean value for each of the subgroups as a scatter graph with drop lines to the average of the mean for each group (X bar). This layer also displays two limit lines that are positioned Num Sigma standard deviations away from the X bar. Num Sigma is defined in the QC1 worksheet window and is three by default.
The lower layer of the QC chart is the R chart. This layer displays the range for each of the subgroups as a column graph. The range for each of the subgroups is plotted from the average line (or R bar). This line represents the groups average range, or the average of the mean range within each subgroup. This layer also displays two limit lines - the UCL and LCL lines. For information on the calculations for the UCL and LCL lines, see "Statistical Quality Control" 5th edition (1980) by Grant, E.R. and Leavenworth, R.S., McGraw Hill, pg 81.