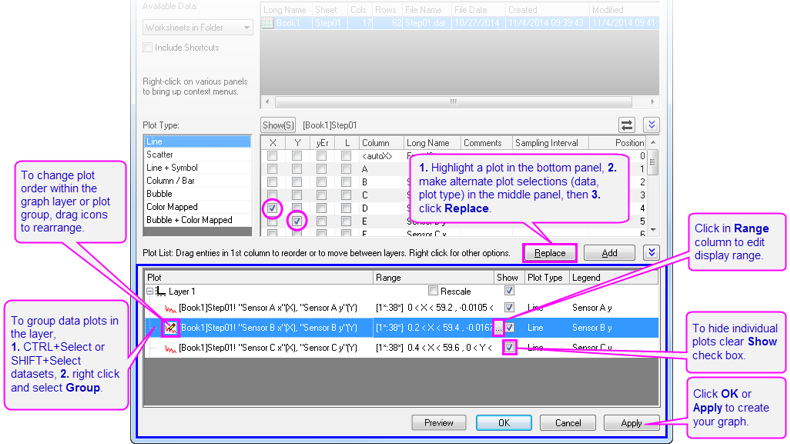
The bottom panel of Plot Setup lists data plots in the graph. Use controls to add, remove or replace the data plots; edit plot display range; group or ungroup data plots; or reorder data plots.
After selecting the data columns in the middle panel, you can select a layer in the bottom panel and then click the Add button to add data plots to the layer.
To replace an existing plot:
|
Note: If the selected plot is grouped with other plots, the plot type change will be applied on all the plots in this group, but not for the designation changes. |
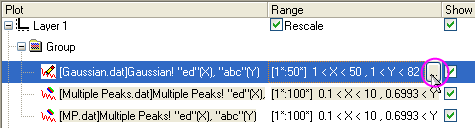
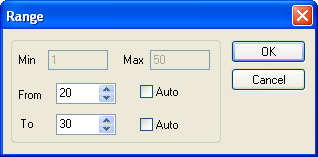
In the bottom panel of Plot Setup dialog, you can alter the display range of a data plot:
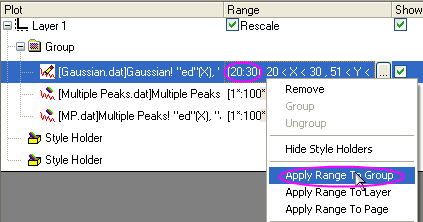
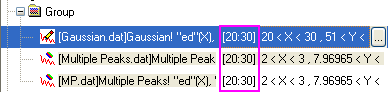
Origin also allows you to apply a range to all data plots in the current layer or page using the same context menu.
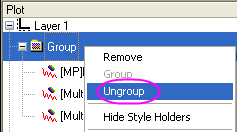
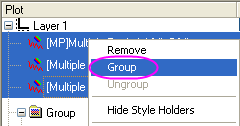
You can manually group or ungroup data plots using the Plot Setup dialog box.
 |
|
| Ungrouping | Gouping |
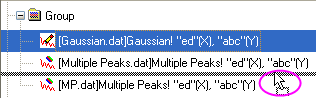
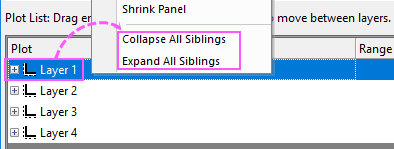
You can reorder the list by dragging member plots.
Right-click on a Layer or Group node to select Collapse All Siblingsor Expand All Siblings to collapse or expand all layer or group nodes.
Clicking the Preview button will open a Preview dialog to show the current plots in graph and the template being used.
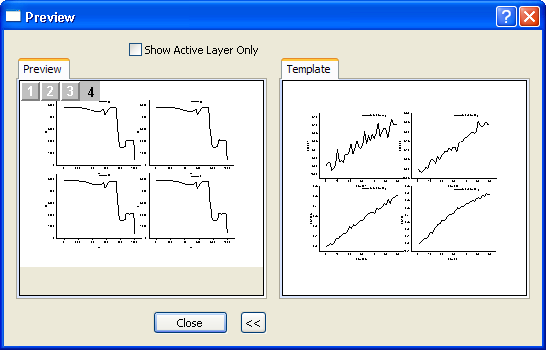
Please note that only when you use the user-defined graph templates saved in Template Library to plot graph , the template image and the Show Active Layer Only check box will show in the Preview dialog.
With the Show Active Layer Only check box checked, you are allowed to switch the layers by clicking the layer icon at the left-top corner of the Preview panel. When you switch the layers, the Template panel will follow the changes.