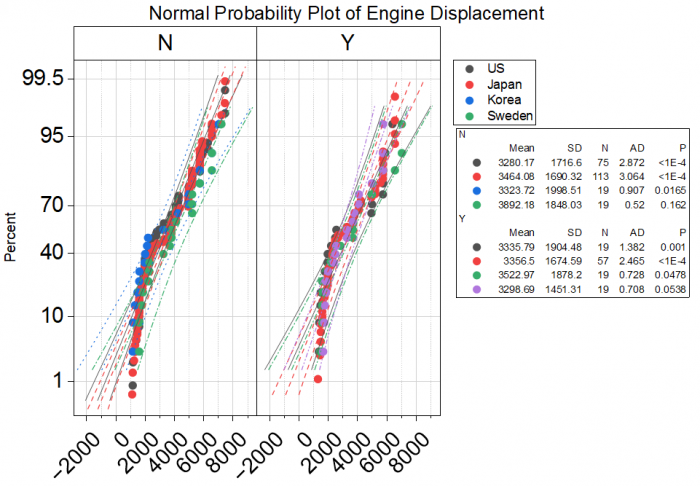
31.9.18 Probability Plot
Data Requirements
Select at least one column to create Probability plot. Select multiple data and group column(s) to compare distribution of different data/groups.
Creating the Graph
Select the required data.
Select
Or
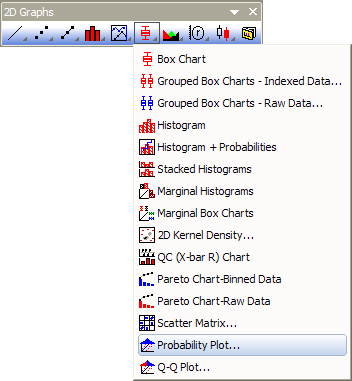
Click the Probability Plot... button on the 2D Graphs toolbar.
Origin opens the plot_prob dialog box.
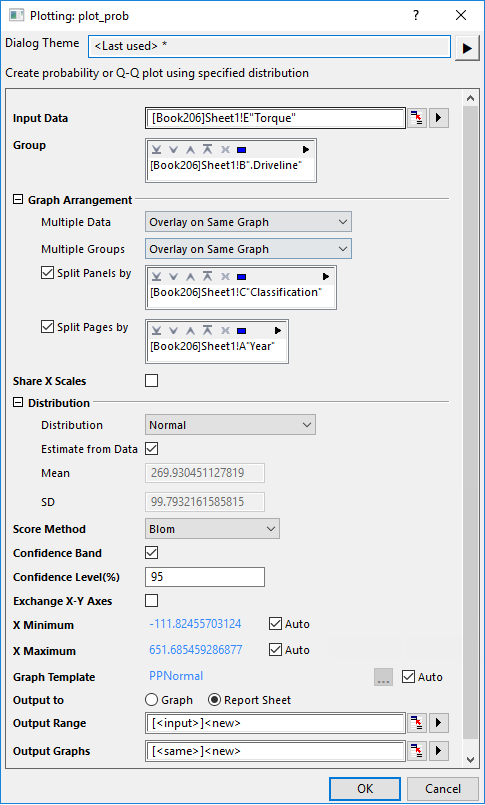
Customize the options in the dialog and then click OK to create the plot. Please see more details on creating and customizing the Probability Plot.
Template
Depending on the distribution type you selected, one of templates below will be used:
- gPPNormal.optu
- gPPLog.optu
- gPPExp.optu
- gPPWeibull.optu
- gPPGamma.optu
(installed to the Origin program folder).
Notes
For information about the calculations for Propability Plot, please refer to Probability Plot and Q-Q Plot.
Version Information
| Minimum Version: Origin 8.1 | Last Update: Origin 2026 |