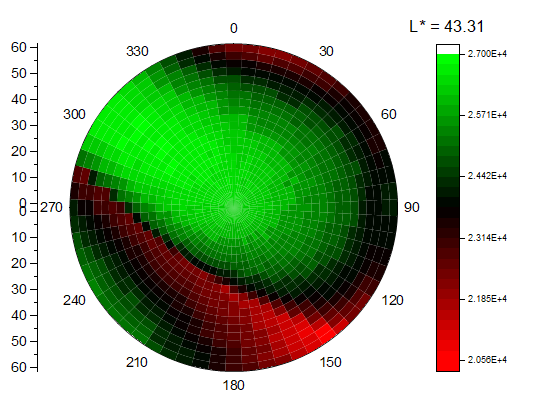
31.18.6 Polar Heatmap
Data Requirements
- Worksheet: Select XY columns or XYZ columns (full or subrange); or a virtual matrix.
or
- Matrix: A matrix sheet. Multi-object sheet is supported.
Creating the Graph
Activate the matrixsheet or select required data from worksheet:
- From the menu, choose .
When you create the polar heatmap from XY data, the dialog plot_heatmapxy will be opened.
When you create the polar heatmap from XYZ data, the dialog plot_heatmapxyz will be opened.
When you create the polar heatmap from multiple Y columns without Z, the dialog plotvm dialog be opened.
Template
PolarheatmapMat.otpu
(Installed to the Origin program folder).
Notes
The polar heatmap is similar with heatmap, but plotted into a polar coordinate.
- When you choose Plot > Contour: Polar HeatMap θ(X)r(Y), all X and Y in label will be changed as θ and R in the X-function dialog plot_heatmapxy, plot_heatmapxyz and plotvm.
- It supports to create a polar heatmap with RGB values in the source Z column or matrix.
Version Information
| Minimum Version: Origin 2025 |