8.3.3 Plotting Data by Groups
Origin provides multiple ways to plot data by different groups. Which way to choose depends on how your data is arranged and what kind of graph you want to plot.
| How your data is arranged | What type of graph you want to plot | Tools to plot |
|---|---|---|
|
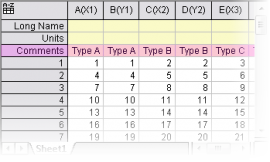
group info in column header row
|
|
menu Plot> 2D: Multi-Panel: Multiple Panels by Label....
|
|
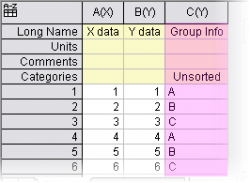
group info in column(s)
|
|
menu Plot> 2D: Cluster Plot Or menu Plot> 2D: Trellis Plot
|
|
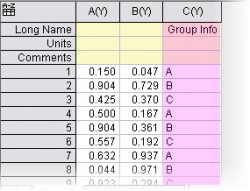
group info in column(s)
|
|
menu Plot> 2D: Bar: Grouped Column - Indexed data
|
|
group info in column(s)
|
|
menu Plot> 2D: Group Box: Grouped Box chart - Indexed data
|