group info in column header row
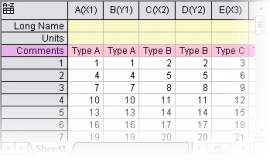
- Line
- Symbol
- Line+Symbol
- Column/Bar
menu Plot> 2D: Multi-Panel: Multiple Panels by Label....
Related topics:
group info in column(s)
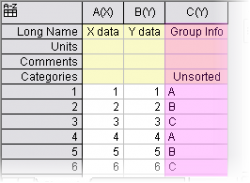
- Line
- Symbol
- Line+Symbol
- Column/Bar
- Stacked Column/Bar
- 100% Stacked Column/Bar
menu Plot> 2D: Cluster Plot
Or
menu Plot> 2D: Trellis Plot
Related topics:
- Cluster Plot and details of the dialog controls
- Trellis plot
- Refer to this Quick Help page for comparision of cluster plot and trellis plot.
- Trellis also supports double-Y axes plot.
group info in column(s)
- Column/Bar chart
menu Plot> 2D: Bar: Grouped Column - Indexed data
Related topics:
group info in column(s)
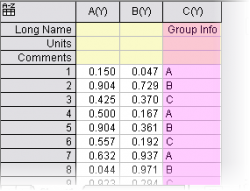
- Box chart
menu Plot> 2D: Group Box: Grouped Box chart - Indexed data
Related topics: