| Dialog Theme | See Peak Analyzer Themes. |
|---|
| Recalculate | |
|---|---|
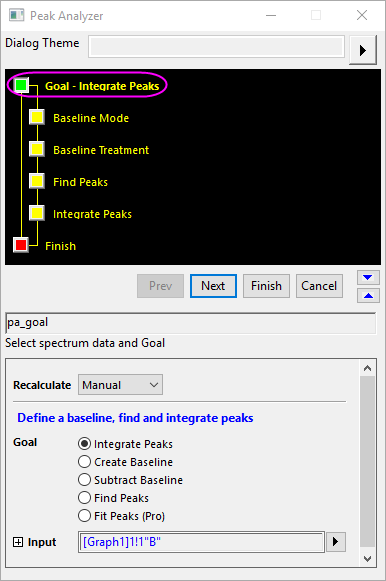
| Goal | Choosing a Goal for the Peak Analyzer determines the analysis routines that will be performed with the tool (for instance, see Baseline Modes, below). When different goals are selected, the Peak Analyzer will include different pages and different wizard maps will appear in the upper panel.
|
| Input |
Only a single range is supported by the Peak Analyzer. See Specifying Your Input Data. From Origin 2020b, you can zoom in/out the plot or customize the X scale range in the graph preview window, and then click the arrow button beside the Input box to select Use X Scale Range to apply the displaying X scale range to the input range. If your data comprise multiple ranges, see the video on Batch Processing of Peak Data using Theme. |
The next page of the Peak Analyzer is the Baseline Mode page. On this page, you will see that there are between four and eight methods of creating a baseline, depending upon the Goal that you select (see table below). Some baseline modes (e.g. User Defined) create additional controls on the Baseline Modes page. Others add a page to the Wizard Map:
| Goal | Available Baseline Modes |
|---|---|
| Integrate Peaks | Constant, User Defined, Use Existing Dataset, XPS, None (Y=0), End Points Weighted, Straight Line, Asymmetric Least Squares Smoothing |
| Create Baseline | User Defined, XPS, End Points Weighted, Asymmetric Least Squares Smoothing |
| Subtract Baseline | Constant, User Defined, Use Existing Dataset, XPS, End Points Weighted, Straight Line, Asymmetric Least Squares Smoothing |
| Find Peaks | Constant, User Defined, Use Existing Dataset, XPS, None (Y=0), Min&Max, End Points Weighted, Straight Line, Asymmetric Least Squares Smoothing |
| Fit Peaks (OriginPro Only) | Constant, User Defined, Use Existing Dataset, XPS, None (Y=0), End Points Weighted, Straight Line, Asymmetric Least Squares Smoothing |