- Menu Command: Analysis: Peaks and Baseline: Peak Analyzer: Open Dialog
- Window Types: Workbook, Graph
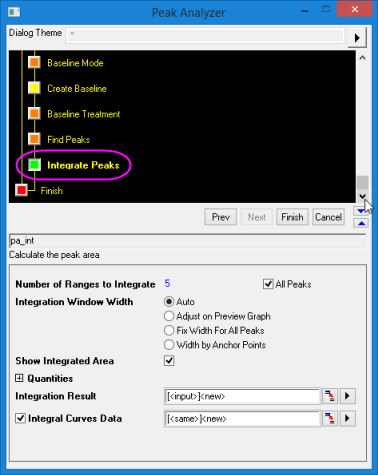
This page is available in the Peak Analyzer only when Integrate Peaks is selected for Goal in the Start page. It can be used to calculate the areas of the peaks that are found by the Find Peaks page.
| Dialog Theme | See Peak Analyzer Themes. |
|---|
| Number of Ranges to Integrate | Use this to specify the number of peaks that will be integrated. When All Peaks is checked you cannot edit the Number of Ranges to Integrate. Un-check the box and enter a number (N), and only the first N peaks will be integrated. |
|---|---|
| Integration Window Width | Use this to specify the width of the integration windows.
|
| Left Half Width | This is available only when the Fix Width For All Peaks radio button is selected. You can use it to set the left half width of the integration rectangle. |
| Right Half Width | It is available only when the Fix Width For All Peaks radio button is selected. You can use it to set the right half width of the integration rectangle. If the Same check box to the right of this control is selected, the value in this edit box will be set to the value of Left Half Width. |
| Integrate From | This drop-down will not appear if your Baseline Mode was None. Use the drop-down to specify whether you want to calculate the peak area from the baseline or from y=0.
|
| Show Integrated Area | Show integrated area on the graph. |
| Show Peak Index Tag | Show peak index tag on the graph. |
| Integration Result | Specifies the destination for the integration result. |
| Integral Curves Data | Specifies the destination for the cumulative integral data. If the box is unchecked, no cumulative data is created. |
The controls in this group can help you to customize the integrate results which will be output to the range specified by Integrate Result. One column of result data will be generated for each checked box.
| Peak Area | Peak areas are calculated by integrating the peak data from the baseline or Y=0 (depending on the selection in the Integrate From drop-down list). |
|---|---|
| Percent Area | Output the percent areas that are calculated by Peak Area/Curve Area. This is the percent of each area compared to the area under the whole curve. |
| Curve Area | Curve areas are calculated by integrating the curve data from the baseline or Y=0 (depending on the selection in the Integrate From drop-down list). This value will be the same for all peaks. |
| Row Index | Output the row index where peak center occurs. |
| Beginning X | The X coordinate of the leftmost data point of each peak. |
| Ending X | The X coordinate of the rightmost data point of each peak. |
| Peak Center | The X coordinate of the peak center. |
| Peak Height | The peak height in Y units relative to the chosen baseline. |
| FWHM | The full width at half maximum height or the peak width at half the peak's maximum value for each peak. |
| Left Half Width | The left half width. If we draw a line for  , this line will intercept with the spectrum data (input data) at two points. Let's denote them as , this line will intercept with the spectrum data (input data) at two points. Let's denote them as ") and and ") , where , where  . Also, we denote the peak center as . Also, we denote the peak center as .") Then we can compute the left half width as follows: Then we can compute the left half width as follows:
|
| Right Half Width | The right half width. If we draw a line for , this line will intercept with the spectrum data (input data) at two points. Let's denote them as and , where . Also, we denote the peak center as Then we can compute the right half width as follows:
|
| Peak Centroid | The peak centroid or center of gravity. Defined as follows:
|


 \; dx}{\int_{0}^{\infty} F(x) \; dx}")