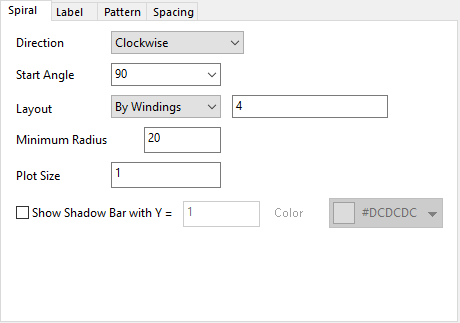
9.3.7.41 The (Plot Details) Spiral Tab
The Spiral tab is used to customize the layout of the bars along the spiral axis and the spiral axis
Contents
Direction
Specify the direction of the spiral axis lines from the center, clockwise or counter-clockwise.
Start Angle
Specify the start angle for the spiral axis at the center. The default angle is 90.
Layout
Specify how to arrange the bars along the spiral axis. There are two layouts:
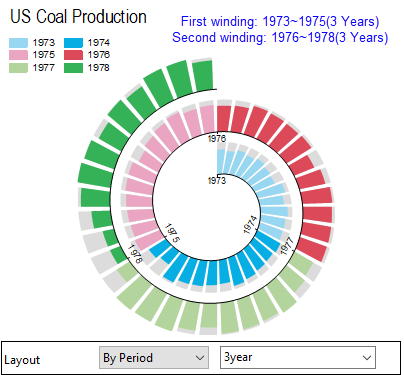
- By Period: Plot the data points as bars by specifying period range within each winding. If you want to plot all bars within each 3 years on each winding, you can select By Period and set period range as 3year.
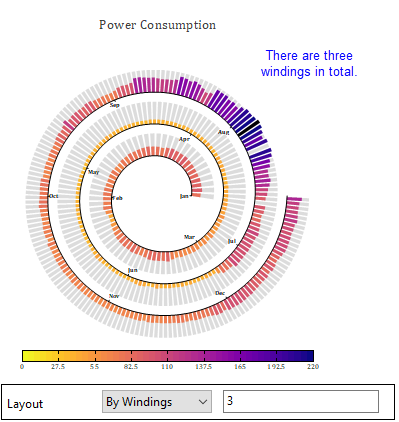
- By Windings: Plot the data points as bars by specifying the number of windings.
Minimum Radius
Specify the radius for the center hollow at the start point. The unit is % of layer.
Maximum Radius + Gap between Windings = Min(Layer width, Layer Height)
Plot Size
Specify the highest bar height of the bars. Plot Size =1 means bar height of the maximum Y value is equal to the gap between each winding.
Show Shadow Bar with Y=
Specify whether show shadow bar under all bars, and the height of the shadow bars.
Color
Specify a color for all shadow bars.