9.3.7.27 The (Plot Details) Contour Lines Tab
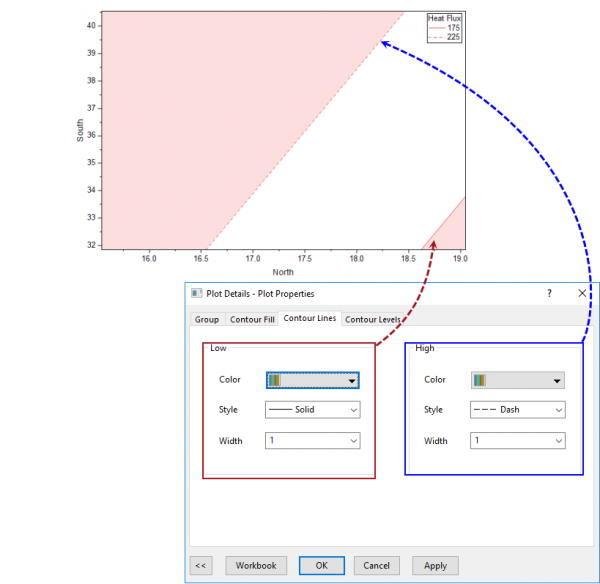
This tab can be used to customize the contour lines of an Overlaid Contour plot.
Color
You can specify the line color(s) by individual contour line or for the entire plot. For help with color controls, see Customizing Data Plot Colors
Style
You can choose a line style for the contour line of low and hight level. By default, contour line of "Low" level is Solid and that of "High" level is Dash.
Width
Specify the line width for the contour lines.