29.9.16 Pareto Chart - Raw Data
ParetoChart-RawData
Data Requirements
Select at least one column or a range from a worksheet column.
Creating the Graph
Select required data.
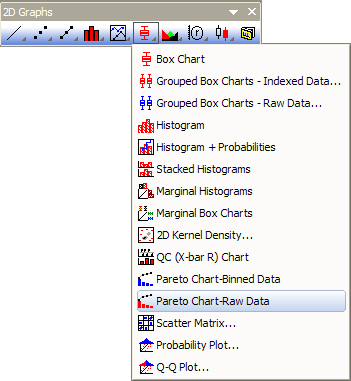
From the menu, select .
or
Click the Pareto Chart - Raw Data button on the 2D Graphs toolbar.
Template
PARETORAW.otp (installed to the Origin program folder).
Notes
- You are allowed to select a grouping column to divide the input data by groups and plot them as pareto charts into different panels or graphs.
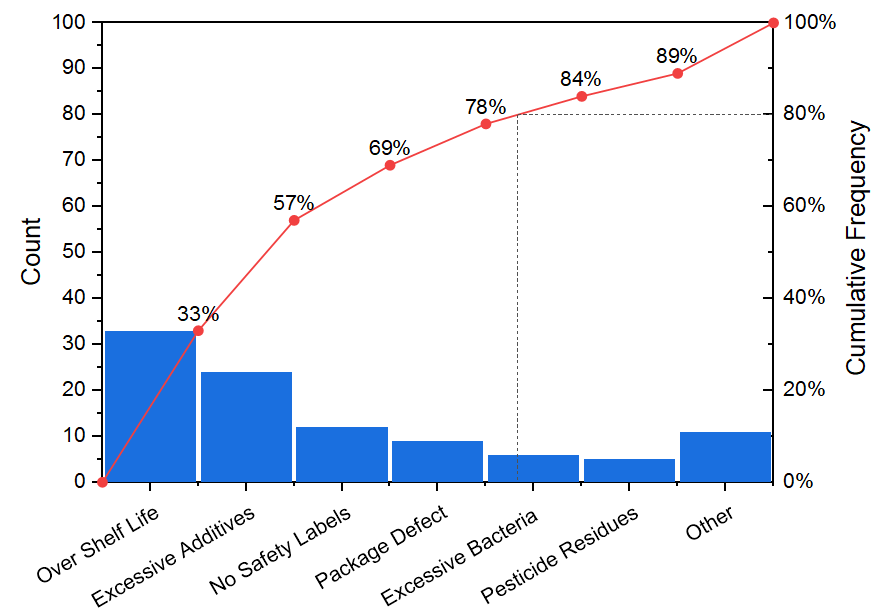
- You can decide whether show the symbol at right side of bar with the check box Show Symbol at Right Side of Bar. If you checked it, this line+scatter plot will start from the Origin(0,0) and put the scatter point at the right-side of bar; And, the first point and last point will not have labels.
- The right Y axis scale is always 0~100. And there are horizontal drop line and vertical drop line at Y = 80.
Please see more details on creating and customizing in the Pareto Charts page.
Version Information
| Minimum Version: Origin 8.1
|
Last Update: Origin 2026
|