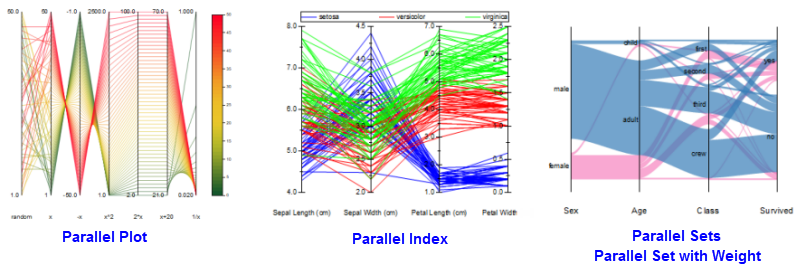
31.9.12 Parallel Index Plot

Data Requirements
Select at least three columns of values or a range of values from at least three columns. Plot designation does not matter; selected columns will be treated as Y columns.
Creating the Graph
- Select required data.
- Select Plot > Categorical: Parallel Index.
or
- Click the Parallel Plot button
 on the 2D Graphs toolbar.

For information on the customizing parallel plots, see these topics:
Template
Parallel.otpu (installed to the EXE folder of Origin)
Notes
- There are three parallel plot variations:
- The basic parallel plot (Plot > 2D: Parallel Plot: Parallel Plot), plots variables on continuous (numeric) scales and uses a color scale for the graph legend.
- The parallel index plot (Plot > 2D: Parallel Plot: Parallel Index) also plots variables on continuous scales but uses a grouping column (a column of Categorical Data) to create the legend and assign plot color.
- The parallel sets plot (Plot > 2D: Parallel Plot: Parallel Sets) plots categorical variables on each axis.
- When you drag and drop a column of values to a parallel plot, the new column will be added to the last.