31.9.34 Paired Comparison Plot

Data Requirements
Select one data column and at least one group column to create the Paired Comparison Plot.
Creating the Graph
Select required data.
From the menu, select Plot > Statistical : Paired Comparison plot to open the Apps: PairedComparisonPlot dialog
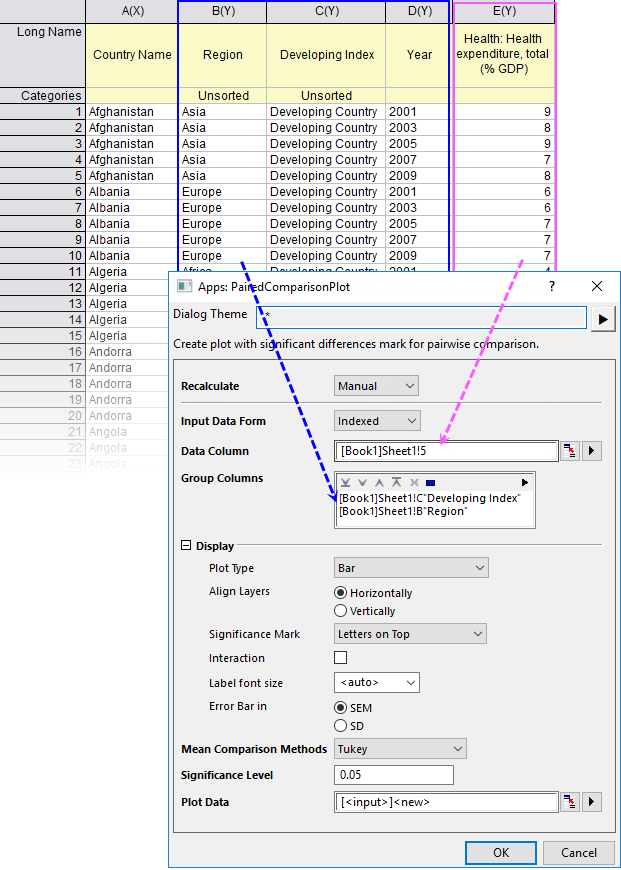
| Plot Type | Choose a plot type for Paired Comparison plot.
|
|---|---|
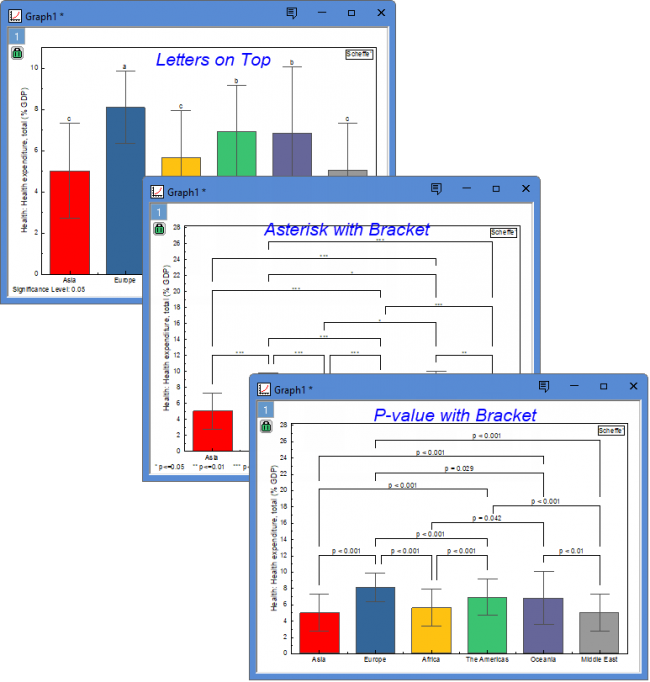
| Significance Mark | Choose a plot type for Paired Comparison plot.
|
| Exclude n.s. in Group | n.s. means not significant. You can choose to exclude these groups. |
| Label Font Size | Specify the font size of significance labels. |
| Error Bar in | For the plot type Bar, Data Points and Scatter With Error Bar, you can choose to display SEM (Standard Error of the Mean) or SD (Standard Deviation) as error bars. |
| Mean Comparison Methods | Choose a method to compare the means. Origin provides eight different methods for means comparison. They are Tukey, Bonferroni, Dunn-Sidak, Fisher LSD, Scheffe, Holm-Bonferroni, and Holm-Sidak. For more details, please refer to this page. |
Template
Bar.otpu or Box.otpu (installed to the Origin program folder).
Notes
Paired Comparison plot is a data visualization and analysis method used to show differences, rankings, or statistical significance between groups or pairs of items.
About how to create the multiple comparisons plot, please refer to this page.
Version Information
| Minimum Version: Origin 2027 |