31.18.13 Overlaid Contour Plot
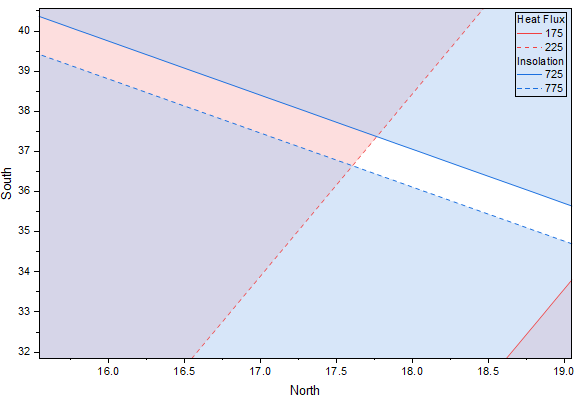
Data Requirements
Select columns designated as "XYZZ..."(or a range from columns designated as "XYZZ...").
Creating the Graph
Select required data.
From the menu, choose .
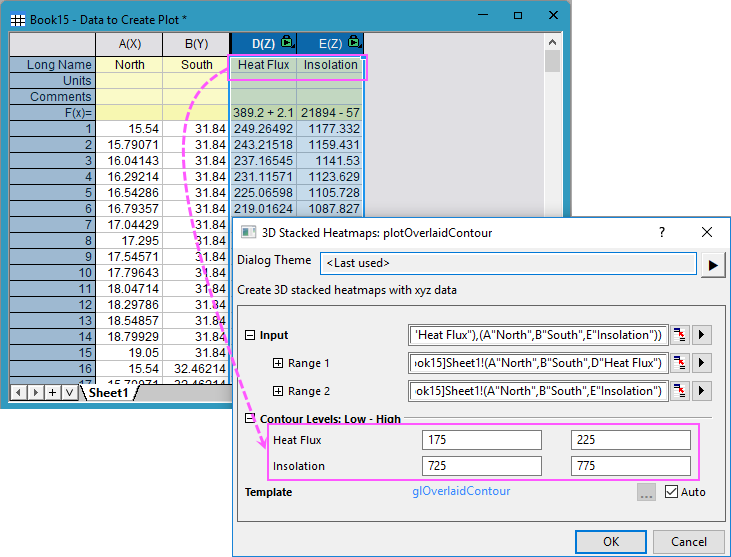
The selected response variables are listed in the dialog to let you specify the Low and High contour levels; Inside this range is feasible region, outside this range is nonfeasible region.
Template
glOverlaidContour.OTPU (installed to the Origin program folder).
Notes
An Overlaid Contour plot can be used to visually identify a region where the predicted means for one or more response variables all fall within an acceptable range, which means the effective trade-offs and compromises can be achieved among the various responses.
The following apps also support accessing and plotting this type of chart:
- General Linear Regression
- Binary Logistic Regression
- Poisson Regression
- Design of Experiments (except Taguchi Design)
There are three tabs which contains all controls of the Overlaid Contour plot in Plot Details dialog: