31.14.4 OHLC Bar Chart
Data Requirements
Select exactly four Y columns (or a range from four columns). The leftmost Y column contains the opening prices, the second Y column displays the highest prices, the third Y column displays the lowest prices, and the rightmost Y column displays the closing prices. If there is an associated X column, X column supplies X values; otherwise, sampling interval of the Y column or row number is used.
Creating the Graph
Select desired data.
Select
or
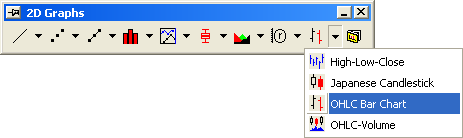
Click the OHLC Bar Chart button on the 2D Graphs toolbar.
Template
OHLCBarchart.otp (installed to the Origin program folder).
Notes
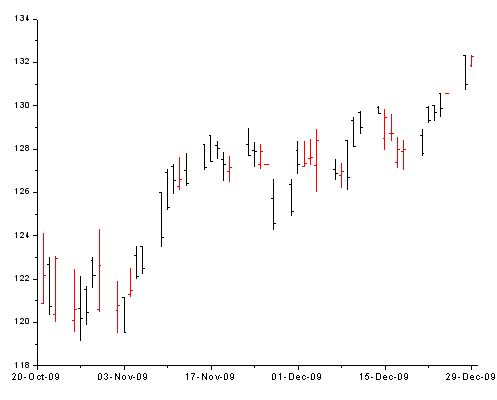
The chart displays the opening, highest, lowest and closing prices of a security over a given time interval. These values are connected by a vertical line. The opening and closing prices display as tick marks on the vertical line.