21.2 NetCDF Manipulating
Manipulation on Matrix Data
After importing a NetCDF file into matrix stack, you can perform manipulation on matrix data.
The following examples show how to use these tools on NetCDF data.
Linear Fit on Matrix Stack
Select Analysis: Linear Fit on Matrix Stack to open the dialog, perform a linear fit on the NetCDF matrix stack.
Descriptive Statistics on Matrix

Select Analysis: Descriptive Statistics to open the dialog to get the descriptive statistics (Mean, SD, Min, Max, Median and Sum) for the matrix stack.
Subtraction

Select Analysis: Mathematics: Subtract to open the dialog, perform subtraction between two same-sized matrice stacks to get the difference between them.
In the following illustration, we'll get the mean value of the matrix from and then perform subtraction with two mean value matrices to get the difference of them.
Subtract Period Average
User Story:

- Beginning with a new matrix window, the user imports a data file of monthly average temperature, for a time span of January 1901 to December 2018. This results in a matrix (matrixsheet) containing 1416 matrix objects -- one object for each month of the time span.
- The user then re-imports the same file but this time, chooses option of Averaging Across Years at m=monthly intervals. This results in a matrix (matrixsheet) containing 12 matrix objects -- obtained by averaging temperatures by month, over the time span January 1901 to December 2018.
- The user wants to subtract the monthly average obtained in step #2 from each month's data, over the original time span. This results in a matrix (matrixsheet) of 1416 matrix objects, each containing the deviation from monthly average, over the January 1901 to December 2018 time span.
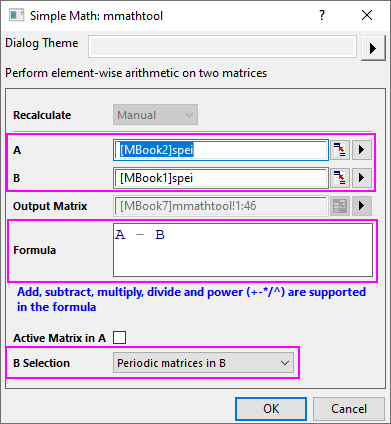
- To perform step #3, the user chooses Analysis: Mathematics: Simple Math.
- For matrix A, choose the matrix containing readings from January 1901 to December 2018 (1416 matrix objects).
- For matrix B, choose the matrix containing the average monthly temperatures over the time span January 1901 to December 2018 (12 matrix objects).
- Enter your formula A - B
- For B Selection, choose Periodic matrices in B.
- Alternately, the user can choose Analysis: Mathematics: Subtract, choose matrix A and matrix B, choose the output matrix and set Subtract = Periodic matrices in B. Either tool should produce the same output, given the above inputs.
Pixel Extraction

Select Matrix: Pixel Extraction to open the dialog, extract the Z value for specified XY coordinates for all matrices in the matrix stack.
To specified XY coordinate values, you can:
- Use Screen Reader pick the point on the matrix.
or
- Manually specify longitude and latitude values in the dialog.
or
- Specify longitude and latitude by reference columns. Then extract z values for multiple XY coordinate pairs all at once.
- Note: You can use the longitude and latitude dataset from shapefiles imported by Import Shapefile App

Interpolation
Select Matrix: Resize to open the msresize dialog, you choose Interpolate as Resize Option to get more detailed information from NC files.
Profiling Matrix Data on ROI


When a matrix is in Image Mode, you can use first select an area using the Rectangle/ Circle/ Polygon/ Region tool  as region-of-interest (ROI), and then extract data from it.
Right-click on the ROI and choose an option from the shortcut menu. To discard the ROI, press Delete.
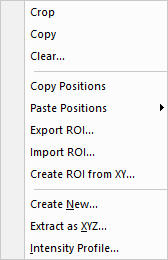
To add multiple ROIs:
Each ROI is added with a default name (e.g. ROI). You can add multiple ROIs to your matrix image but you need to rename each ROI before you can add another.
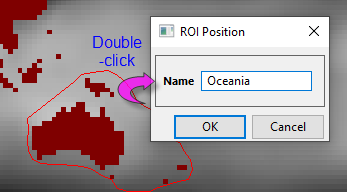
- Double-click on the ROI to open the ROI Position dialog box.
- Give the ROI a meaningful (unique) name and click OK.
 | If you’ve zoomed in the matrix and thus the ROI has scrolled out of view, you can locate the ROI in the Object Manager (docked top-right by default), right click on it and select Scroll To to bring the ROI back to the center instantly. |
Copy and Paste Positions
Copy the position of the selected ROI. Then paste the position of the selected ROI to another ROI (width, height...all).
Export and Import ROI
Save the ROI object(s).
Replace the object(s) with those in a saved .ROI file (hint: create a "dummy" ROI to import).
Create ROI from XY

Right-click inside the matrix or on a ROI box, select Create ROI from XY, then use the xy2roi dialog to choose the XY boundary and index data from worksheet for defining the ROI. Optionally specify the ROI name and group info.
For example, the image below shows how to use a shapefile boundary to craeate a ROI.
Create New
Use the mroi2mat tool to generate a new matrix from the ROI.
Extract as XYZ
Use the mroi2xyz tool to generate a new worksheet of XYZ values in the ROI.
Intensity Profile
Right click on the ROI box and select Intensity Profile, then use the mroiprofile dialog to get the descriptive statistics ( Mean, SD, Min, Max, Median, Sum, etc.) for the ROI. The Weighted ROI checkbox will apply a weight to the pixels on the boundary, where each pixel (a rectangle point) is weighted by the area inside the ROI polygon. This improves accuracy when the ROI coordinates do not fully cover a pixel.
The image below shows how to perform Intensity Profile on a ROI created from a shapefiles dataset (Create ROI from XY.
| There can be a speed issue when there are many ROIs, Profile on = All ROIs on Matrix and Data Layout = Matrix Rowwise. The slowness is caused by maintaining output columns of Report Data. In such cases, if the original output has number of columns greater than @RDRC, output will simply remove all original columns. However, it should be noted that removing all output columns will also cause plots made from output, to be destroyed. |
Clear Data in ROI
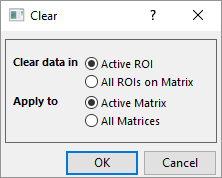
Add ROI on the matrix, right-click on the ROI and select Clear.
Across Multiple Matrix Sheets

For the 4D matrix book matrix book (the 4th dimension is sheets), the single ROI will be displayed across matrix sheets. And the ROI will be displayed on the active sheet.
For this ROI, it also supports Create New, Extract XYZ and Intensity Profile tool. And it will generate the active matrix sheet’s result. Switching sheets, the result will update for the active sheet.