29.6.15 Multiple Y Axes Graph
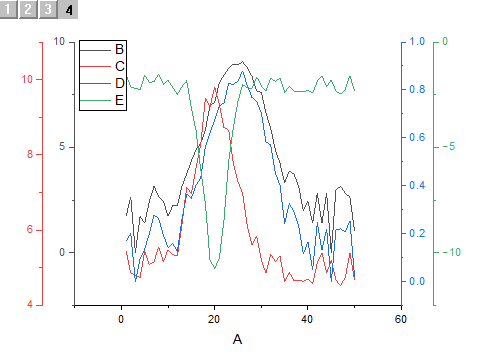
MultiY-Graph
Data Requirements
Requires a selection of Y column(s) (or a range from Y columns). If there is an associated X column, X column supplies X values; otherwise, sampling interval of the Y column or row number is used.
Creating the Graph
Select the required data.
Select .
or
Click the Multiple Y Axes... button on the 2D Graphs toolbar.
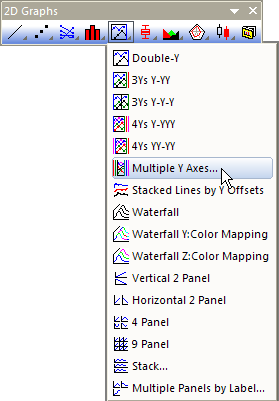
Origin opens the plotmyaxes dialog box.
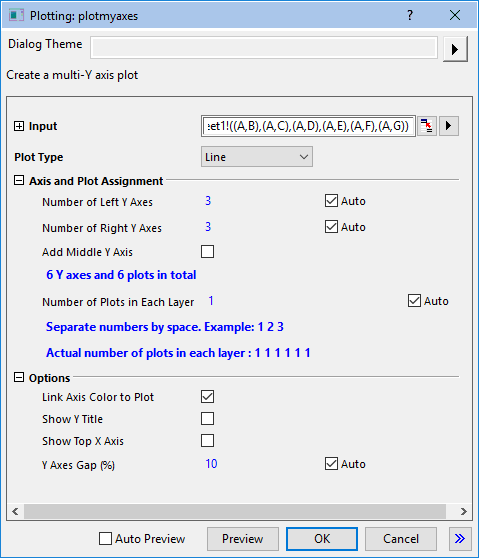
Customize the graphing options, including the plot type of each plot in the layer, the number of Y axes to the left, right, or in the middle of the graph and the display of the Y titles and the top X axis, etc. See details here
Template
OffsetY.OTP (installed to the Origin program folder).
Notes
- The multiple Y axes graph is composed of multiple layers. Each Y axis is a separate layer.
- When the worksheet data selection includes a single X column, each Y column will be plotted to its own layer, by default.
- When the worksheet data selection includes multiple X columns, the number of layers will = equal the number of X columns, and each Y column will plot against the nearest X column to the left of the Y column, by default.
- By clearing the Auto boxes beside Number of Left Y Axes and Number of Right Y Axes, you can manually specify the number of left- and right-Y axes.
- By clearing the Auto box beside Number of Plots in Each Layer, you can enter a space-separated list of plots to add to each layer.
- Plots will be grouped within the layer and differentiated by any plot properties that were set to Increment when the graph template was saved.
- If you select Column as Plot Type, the option Column/Bar/Box Gap Across Layers will be checked by default.
- Multiple X axes will be linked to the X axis of Layer1 in a Straight(1 to 1) fashion. Y axes are not linked.