31.7.6 Multiple Panels Graph
Data Requirements
Select at least one Y column of values (or a range from at least one column). For each Y column, if there is an associated X column, X column supplies X values; otherwise, sampling interval of the Y column or row number is used.
Creating the Graph
Select the required data.
Select .
or
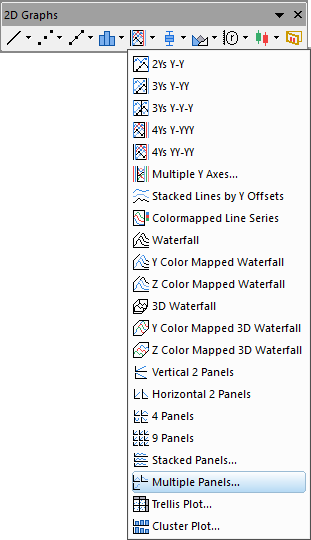
Click the Multiple Panels... button on the 2D Graphs toolbar.
Origin opens the plotbylabel dialog box.
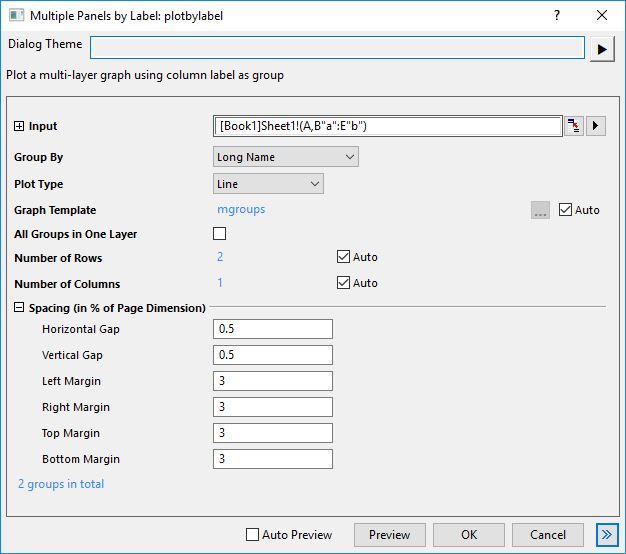
Specify the Group By, Plot Type, Graph Template, groups placement, Panel Arrangement and Panel Spacing for the selected data sets. Click OK to generate the plot. For more information about this dialog, please refer to this page.
Template
MGROUPS.OTPU (installed to the Origin program folder).
Notes
- You can select Number of Plots under Group by drop-down list to use the number of plots in each group to divide the input plots into separate layers.
- You can choose All Groups in One Layer box to place all plots into same layers under different groups. Once you check this check box, all nodes under it will be uneditable.
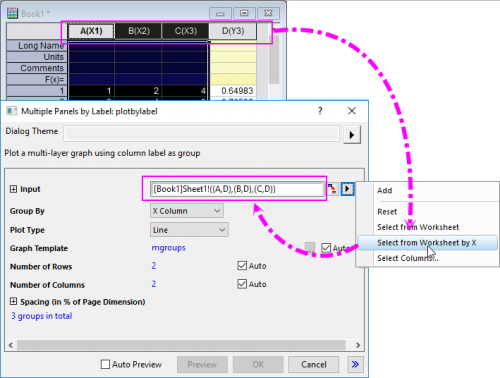
- If you have multiple continues X columns and then one adjacent Y column, such as XXXY columns, you can select Select from Worksheet by X from the flyout menu to select multiple XY ranges as input.
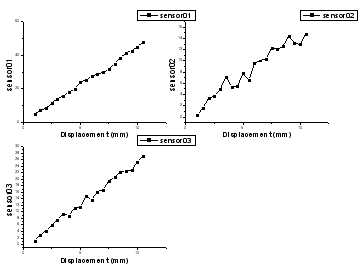
- The multiple panels by label graph contains multiple layers. The number of layers is decided by the number of groups of the input data. The input data are grouped according to the column label row or X columns that is chosen for the Group By.
- You can use the Plot Details Common Display controls for simultaneous editing of layer, plot and axis properties in a multi-layer graph. For more information, see The (Plot Details) Layers tab controls.
- You are allowed to specify a graph template by using the Graph Template control to apply the formats saved with the template on the panels. By default, the built-in template mgroups.optu will be used on the panels.