Select one or more Y columns or a range from a worksheet column.
Select required data.
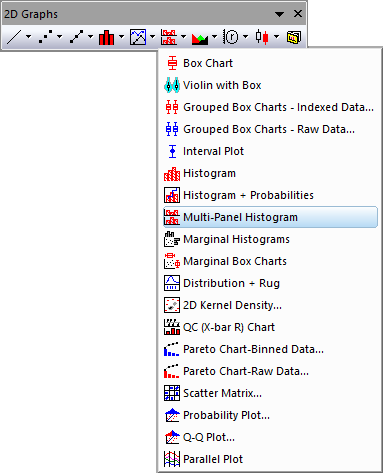
From the menu, select .
or
Click the Multi-Panel Histogram button on the 2D Graphs toolbar.
No template for this type of graph.
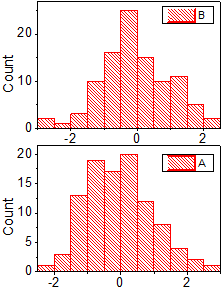
The menu command plots each selected data set in its own layer in a graph window (using the same bin limit for each layer).