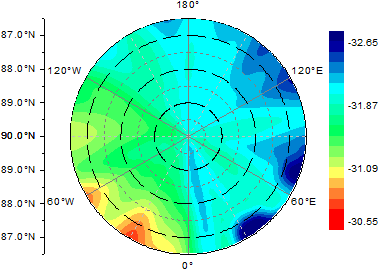
31.18.11 Polar Contour from Matrix Data
Data Requirements
A matrix of Z values. The X and Y coordinates of matrix data represents the Angular (Units are in degrees) and Radius respectively.
Creating the Graph
Click on the matrix to activate it.
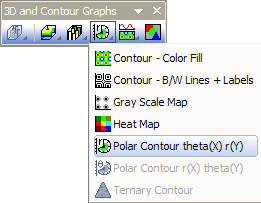
From the menu, choose .
or
Click the Polar Contour theta(X) r(Y) button on the 3D and Contour Graphs toolbar.
Template
PolarContourMat.otp (installed to the Origin program folder).
Customizing the Graph
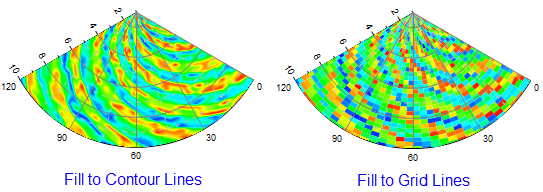
Polar contour plots of matrix data support two fill options:
- Fill to Contour Lines
- Fill to Grid Lines
For more information, see The (Plot Details) Color Map/Contours Tab, Color Fill Control Group.