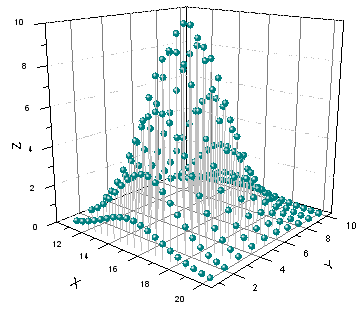
29.17.1 3D Scatter Graph
Mat-3DScatter
Data Requirements
- Select at least one Z column (or a range from at least one Z column). If the Z column has associated XY columns, then the XY columns are used; otherwise, the worksheet's default XY values are used.
- or
or
- Matrix: A matrix of Z values.
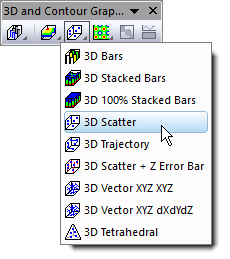
Creating the Graph
Activate the matrixsheet or select required data from worksheet
From the menu, for worksheet data, choose ; for matrix data, choose .
or
Click the Matrix 3D Scatter button on the 3D and Contour Graphs toolbar.
Template
Worksheet
Matrix
- gl3DSCATTERMAT.OTP (OpenGL)
- 3DSCATTERMAT.OTP
(Installed to the Origin program folder).
Notes
- To make this graph you must select columns designated as X, Y and Z.
- To plot the X error and Y error onto the 3D scatter,
- organize the data columns as X, XErr, Y, YErr and Z, then highlight them all to plot a 3D scatter plot.
- add X, Y and Z error bars to the graph after it is created by clicking Format: Plot, then clicking on the Error Bar tab of Plot Details and designating error bar datasets.
- If you want to plot a 3D scatter with Z error directly, you need to select one more Z data and then select Plot> 3D : 3D Scatter + Z Error bar. Of course, you can add Z error bars to an existing 3D scatter graph in the Error Bar tab of Plot Details.