31.9.35 Marginal Plots

Data Requirements
Select at least one XY column.
Creating the Graph
Select required data.
From the menu, select Plot > Statistical: Marginal
If you have multiple sets of XY columns, you can also select Plot > Statistical: Grouped Marginal
Origin opens the plot_marginal dialog box.
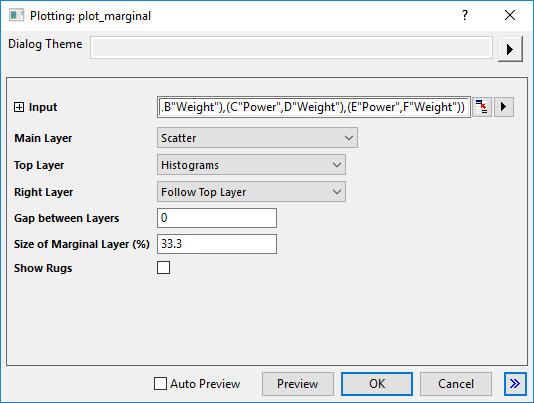
Customize the options in the dialog and then click OK to create the plot. Please see more details on creating and customizing the Marginal Plot.
Template
Marginal_Scatter.OTPU; Marginal_Contour.OTPU (installed to the Origin program folder).
Notes
- You can directly plot Marginal Box Charts and Marginal Histograms from the plot menu.
- After you plotted a marginal plot, you can double-click on each layer to open Plot Details to customize it further or check the intermediate data.