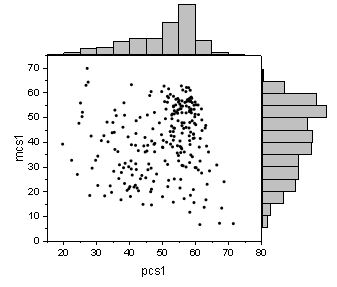
31.9.34 Marginal Histograms Graph
Data Requirements
Select at least one X column and one Y column.
Creating the Graph
Select required data.
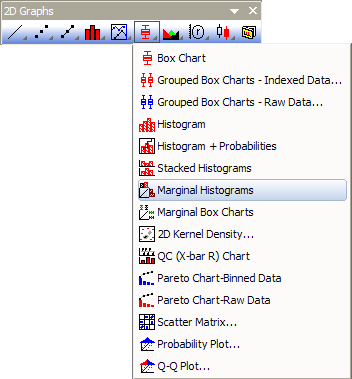
From the menu, select .
or
Click the Marginal Histograms button on the 2D Graphs toolbar.
Template
MARGINHIST.OTP (installed to the Origin program folder).
Notes
This graph is composed of three layers. One is a 2D scatter plot. A horizontal histogram represents the Y-dimension distribution of the scatter data. A vertical histogram represents the X-dimension distribution of the scatter data.