31.9.41 Main Effects Plot

Data Requirements
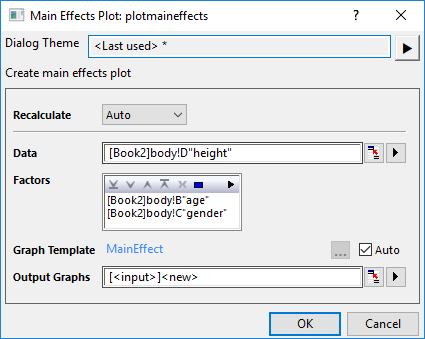
Select at least one data column and one factor column to create main effects plot by factor(s).
Creating the Graph
Select required data.
From the menu, select Plot > Statistical: Interaction Plot to open the plotmaineffects dialog
Template
MainEffect.OTPU(installed to the Origin program folder).
Notes
The Main Effects plot is very useful when you have several categorical variables. You can use it to compare the changes in the level means to see which categorical variable influences the response the most.
Origin's Main Effects plot allows you selecting multiple response data as Input data and multiple categorical varaibles as Factors. Each input column will be plotted as a seperate Main Effects plot, and each factor will be plotted as a graph layer. In each layer, each value of the factor will be plotted as a data point with its mean response values. The mean of whole response data will be plotted as a dash reference line.
Version Information
| Minimum Version: Origin 2025b |