31.3.2 Line Series Graph
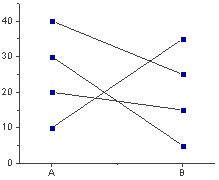
Data Requirements
Select at least two columns of values.
Creating the Graph
Select required data.
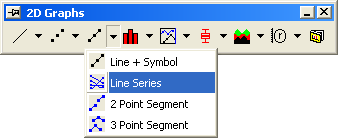
Select .
or
Click the Line Series button on the 2D Graphs toolbar.
Template
BoxLser.otp
Notes
This plot type was improved for Origin 2017 and is now based on the box plot. The plot is more easily customized, including setting plot attributes using other columns from the worksheet.
- There is no hidden worksheet created.
- You are no longer limited to plotting two or three Y columns.
- The multiple Y columns are now treated as a plot group, making for easier customizations.