8.5 Graph Legends
Contents
Overview
Origin supports four legend objects and two scale objects. This page focuses on legend objects. For information on scale objects, see Color Scales and Bubble Scales.
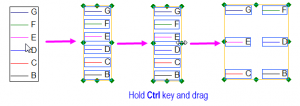
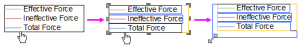
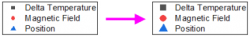
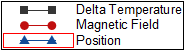
| The Data Plot Legend | The Categorical Values Legend | The Point-by-Point Legend | Box Chart Components Legend |
|---|---|---|---|
|
|
|
|
Graph Legend Components
The four graph legends above share the following components:
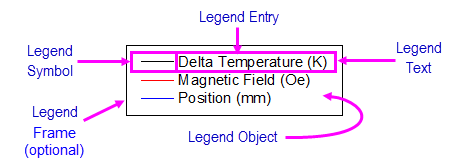
The graph legend is a special text object that is automatically created on the graph page. The legend object is given a specific name -- "Legend" -- and programmatically linked to your Origin project data using LabTalk notation. You will not see this notation unless you are editing the legend object. Normally, what displays is the "translated" symbol and legend text.
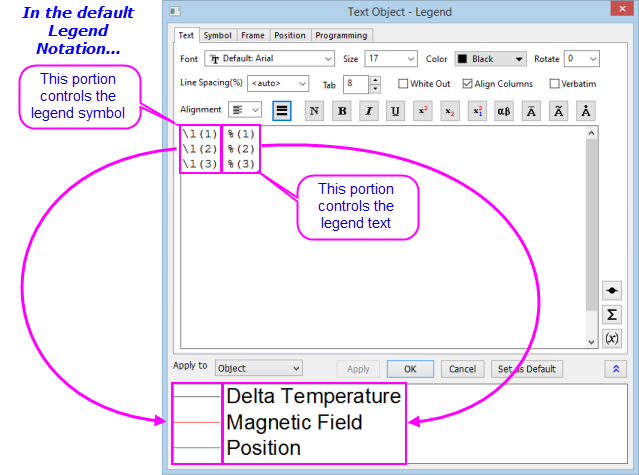
This image of a typical legend's Object Properties dialog box shows the LabTalk notation in the center of the dialog and the "translated" legend symbol and legend text -- what you actually see on the graph page -- in the lower part of the dialog.
It is generally preferable to use plot-associated metadata in combination with dialog box settings, to create the legend symbol and text. For information on how to set that up, see:
- The Plot Details Legends/Titles tab
- The legendupdate Dialog Box.
- Displaying Supporting Data in Worksheet Header Rows
However, you are not limited to programmed legends. At times, a manual edit of the legend object is the quickest way to get the job done. Since the legend is a text object, you can edit it using methods common to all text objects:
- To open the Legend dialog box, press Ctrl + double-click on the graph legend text or right-click and choose Properties.
- To enter "in-place" edit mode double-click.
Double-clicking on the graph legend symbol opens the Plot Details dialog box. Presing Ctrl + double-clicking on the graph legend text opens the Legend dialog box. |
Legend Customization
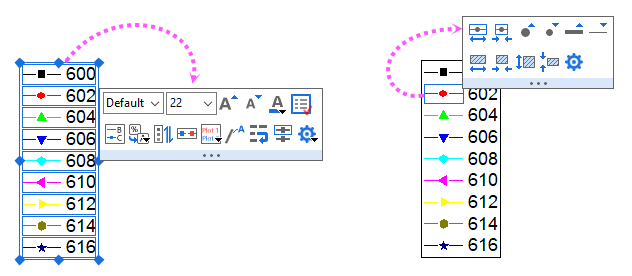
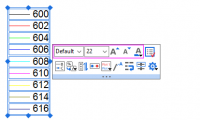
There are Mini Toolbars dedicated to legend customization. Available buttons will vary by plot/legend type.
- To display the toolbar, click the legend box or one symbol in the legend box.
-
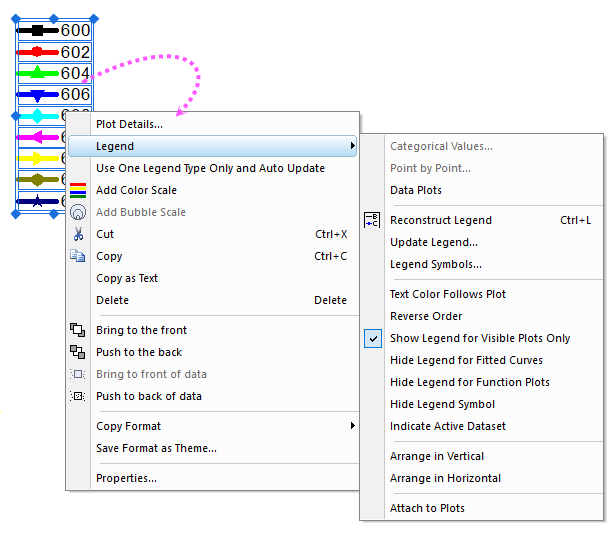
And, you also can right-click on the legend to expand the short-cut menu to customize the legend:
| To do | Using Mini Toolbar | Using Other Controls | ||
|---|---|---|---|---|
| To delete the entire legend object | Delete key, or Delete shortcut menu. | |||
| To add background to the legend box: | Fill Color button | |||
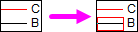
| To show or hide the frame of legend box: | Frame button |
|||
| To modify thickness or color of the frame line | Line/Border Color button  on the Style toolbar on the Style toolbar
| |||
| To resize the legend | Select the legend object, then drag one of the selection handles. | |||
| To arrange the legend entries | Arrange in Horizontal |
| ||
| To adjust padding between legend entries and the background | Point to outside edge of the legend object and when the pointer becomes a "hand", click once to show handles. Drag a handle to add or subtract padding.
| |||
| To increase the legend symbol width | Larger Symbol Width button |
Legend Symbol Width (% of Font) in Legends/Titles tab of Plot Details. | ||
| To change the line spacing between legend entries | Line Spacing (%) list in Text tab of Text Object - Legend dialog. | |||
| To adjust the symbol size | Increase Scatter Symbol Size button |
Click the Symbol tab and set Scatter Symbol Size in Text Object - Legend dialog.
| ||
| To modify the legend symbol line width | Increase Line Thickness button |
Click the Symbol tab and set Line Thickness in Text Object - Legend dialog.
| ||
| To modify format of the legend text | Set Font, Font Size, Increase Font Size , Decrease Font Size and Font Color button
|
Format toolbar.
| ||
| To make the legend text color follow the symbol color | Set Font Color button |
| ||
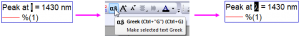
| To add special characters (symbols, Greek characters, etc.) to the legend | Click More button |
| ||
| To reorder legend entries | Reverse button |
| ||
| To update the legend object after adding or removing plots/special points | Reconstruct Legend button |
| ||
| To construct a single legend for multiple layers | Legend: Update Legend short-cut menu. In the legendupdate dialog box, set Update Scope to Whole Page; Update Mode to Reconstruct; and Legend to One Legend for Whole Page. | |||
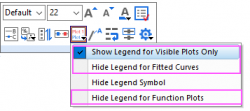
| To show or hide certain legend entries | Click Show/Hide button |
Legend:Show Legend for Visible Plots Only, Legend: Hide Legend for Fitted Curves or Legend: Hide Legend for Fucntion Plots short-cut menu | ||
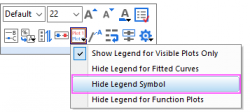
| To hide legend symbol(s) | Click Show/Hide button |
Legend: Hide Legend Symbol short-cut menu | ||
| To show the active dataset indicator | Indicate Active Dataset button |
| ||
| To attach the legend texts to plots | Attach to Plots button |
Legend: Attach to Plots short-cut menu
Note:
| ||
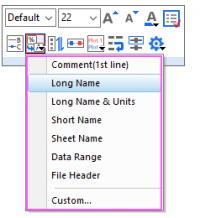
| To change the legend text to other variable of the plot(such as the column label rows) | Data Plot Legend Translation Mode button
|
Translation Mode of %(1),%(2) control in in Legends/Titles tab of Plot Details. | ||
| To wrap the legend text | Wrap Text button |
Go to Frame tab of Text Object - Legend dialog, check Wrap Text, Adjust Height.
If you are manually editing legend text and you need to wrap a long string, see the \ww(literal text) escape sequence. Also, see use of "%(CRLF)" to hard-code a line break (next). | ||
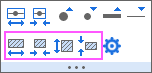
| To change legend symbol block height/width | Pattern Block buttons
|
Legend Symbol Block Width and Legend Symbol Block Height drop-down list in Symbol tab of Text Object - Legend dialog | ||
| To use "dumbbell-shaped" symbols in Line + Symbol legends | Symbol+Line Style drop-down list in Symbol tab of Text Object - Legend dialog
| |||
| To align the legend text |
| |||
| To reconstruct legend to show only one legend type, and update legend automatically | Right-click on the legend, select Use One Legend Type Only and Auto Update | |||
| To remove repeated legend entries when you used one column label row to control plot color | Reconstruct Legend button |
Right-click on the legend, select Legend: Reconstruct Legend |


Other Manual Customization Tasks
- To modify the size of a single legend symbol:
- Use the \L([LayerIndex.]PlotIndex[,PointIndex][,S:SizeOption]) syntax. The SizeOption can be specified in two ways: S:##, where ## is the point size of the plot symbol (upper-limit of approx. 16 pt); or S:p##, where p## is the percentage of the font size (values limited to 1 - 99). So, for example, the legend notation might read \l(3,s:24) %(3), where s:24 specifies a symbol size of 24 points; or \l(3,s:p50) %(3), where s:p50 specifies a symbol size that is 50% of font size. For a complete explanation of this notation, see Legend Substitution Notation.
- To insert information in worksheet column label rows into the legend text:
- Use the legendupdate dialog box. Right-click inside the graph layer and choose Legend: Update Legend. Choose a legend text option from Auto Legend Translation Mode. For more options, choose Custom then click the arrow to the right of Legend Custom Format (@D, @LU etc). Note that Custom allows header information to be concatenated. See this topic for a complete list of @options.
- To manually insert worksheet column label row information into the legend text:
- Use the syntax %(PlotIndex,@option). To combine multiple @options interspersed with arbitrary text, use %(PlotIndex,@(@option1+@option2+...)) as shown below. See this topic for a complete list of @options.
-
 .
.
- Another option for inserting worksheet-stored variable information into the legend text:
- Ctrl + double-click on the legend text to enter "in-place" edit mode. Right-click and choose Insert Info Variables from the shortcut menu. For more information on the Insert Variables dialog box, see this page.
- To hard-code a line break into the legend text:
- In the legendupdate dialog box, set Auto Legend Translation Mode to Custom and insert "%(CRLF)" into your format string. You can do the same thing in Plot Details. Go to the Legends/Titles tab, set Translation mode of %(1), %(2) to Custom and enter your custom legend text, to include "%(CRLF)" at the point where you want the text to break to a new line.
- To add a separator between lines of legend text:
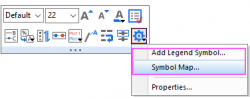
- To manually add legend symbols and text that are independent of any data plot:
- Double-click on the legend object to open the Legend dialog box. Click the Text tab, then click the Add Legend Symbol
 button in the lower-right corner of the dialog. Start a new line in the text box, add your legend symbol then manually add your legend text following the legend "symbol" code. Note that "symbol" may be symbol, line or line + symbol.
 -

- Other methods for adding legend symbols that are independent of any data plot:
- To ensure that your legend customizations cannot be overwritten by reconstructing:
- Rename the legend object. Right-click on the legend and choose Properties. Click on the Programming tab and change Name to something other than "Legend".
- To apply your legend customizations to another graph legend:
- Right-click on the customized legend, select Copy Format and choose an option. Right-click on the target legend and choose Paste Format To and choose an option (see Copying and Pasting Formats).
Customizing Special Legends
The four types of legend objects can co-exist in one graph. For example, you may have multiple Y datasets and plot them as a box chart. However, you would like to show both the data plot legend and the box chart component legend.
- Once a graph is created, clicking the Reconstruct Legend
 toolbar button will create the most appropriate legend for your graph.
 - When you right-click a legend object and point to the Legend context menu, the 1st group in the sub-menu will show applicable legend objects for your graph. If you choose one of these legends, it will be appended to the existing legend. Note: Each type of legend object can appear only once in the graph layer.
- The same menu options are also available from the Graph menu and when right-clicking in the graph.
- Each special legend has a corresponding dialog for customizing the menu.
|
Topics covered in this section: |