20.1 Introduction
Contents
Image window
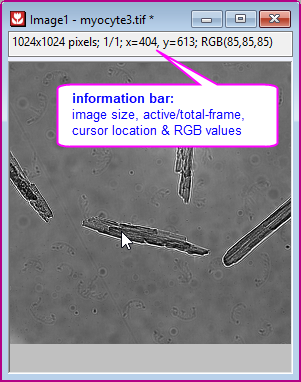
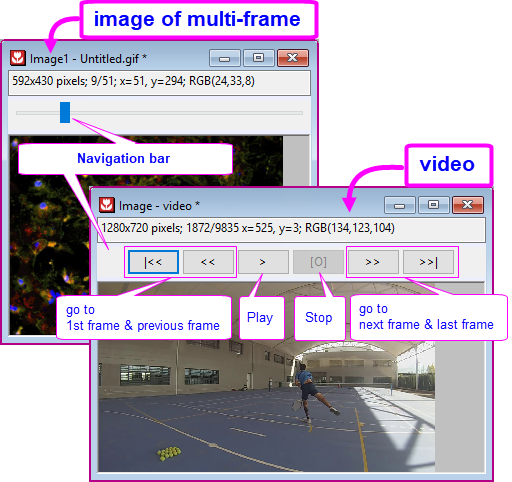
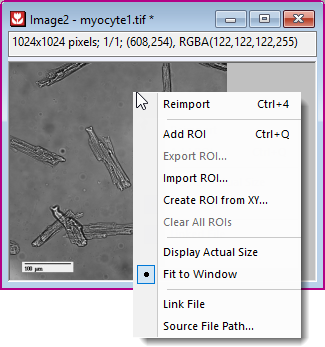
From version 2021b, Origin introduces a new Image window to load and save images. It employs OpenCV for processing and analysis routines. The new image window is a single-layer window, like the one below. It has an information bar on the top (otherwise you can select View: Show Information to turn it on) and if a video or multi-frame image, a navigation bar at the bottom (or View: Show Navigation to turn it on). It is responsible for almost all image processing performance.
| Single-Frame Image | Multi-Frame Image or Video |
|---|---|
|
|
Image window vs. Matrix window
|
Import Images and Videos
Refer to this document page for details.
Menus for Basic Operation on Window
- Edit: Cut: clear the active image window.
- Edit: Clear: if a ROI is selected, this menu will delete the ROI; if the image window is selected, this menu will clear the window.
- Edit: Copy: if a ROI is selected, this menu will copy the ROI. If the image window is selected, this menu will copy the image. You can then paste it to a graph window as an object or to an image window.
- Edit: Paste: paste the copied ROI or image.
- View: Information: show/hide the information bar
- View: Navigation: show/hide the Navigation bar
Export Images and Videos
Refer to this page for details.
Basic Operations on Image Window
Besides tools under Image main menu, toolbar buttons and context menus are provided for quickly access to basic manipulations.
Mini-Toolbar
- Clicking anywhere inside the image layer will pop up a mini toolbar.
- Single frame Image:

- Video:
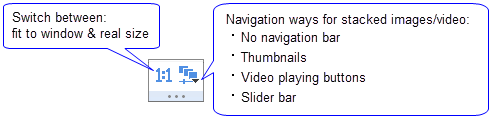
- Multi-frame stacked Image:
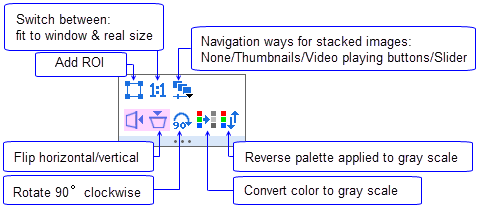
Applying Palettes to Grayscale Images
Color palettes can be applied to grayscale images in the Image window.
- Click the Mini Toolbar Gray button
 , if necessary, to convert an image to grayscale.
 - Apply a palette to the grayscale image by clicking the Palette button
 on the Style toolbar.
 - Click the Mini Toolbar Reverse Palette button
 to reverse application of the chosen palette.
From the Palette list on the Style toolbar, click More Palettes to open the Color Manager dialog box and add more palettes. |
Context Menu
| Add ROI | See what you can do with a ROI below. |
|---|---|
| Import ROI... | Create a ROI box by applying details of a previously-saved ROI. See "Region of Interest" section of how to save ROI settings. |
| Create ROI from XY... | Create a ROI box of arbitrary shape from a set of XY coordinates (boundary) and index data. Refer to "Region of Interest" section to learn more. |
| Display Actual Size/ Fit to Window |
|
| Link(ed) File | Check this to link the image to the source file. See the difference of link and unlink file here.
Note: The Status Bar will indicate whether the image has been linked. |
| Source File Path | Open a dialog to change the source of the image file. See details of saving and changing the image path here. |
Change Background Color
- Use Fill Color button
 on toolbar to change image’s background color.
- Use Labtalk script page.basecolor= to change image’s background color. Refer to Labtalk Page object
page.basecolor= 3; // Change image background color to green.
Region of Interest
To add a ROI box
- Click the Add ROI button
 on minitoolbar (the shape of the ROI box is the <Last used> one)
- Click the Add ROI button
- Or,
- Click the triangle ▼ next to Rectangle Tool button
 on Tools toolbar, select one of the shapes (Rectangle, Circle, Polygon, Region Tool) from the sub-list. Drag a region on the image.
- Click the triangle ▼ next to Rectangle Tool button
- Or,
- Right click inside Image window and select Add ROI context menu (the shape of the ROI box is the <Last used> one)
To add multiple ROI boxes to a single Image window:
- After adding a ROI box to the image,
- click the Add ROI button on minitoolbar, or
- right click and select Add ROI context menu
- click the Add ROI button
- to add another ROI box.
- Or,
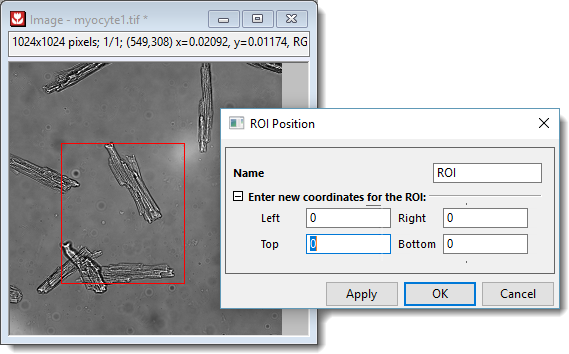
- After adding a ROI box to the image, double click on it to open the ROI Position dialog box. Rename it to something like "ROI1".
- Add a new ROI box by one of the 3 ways in above section.
Once added, you can view all the ROIs in Object Manager and perform basic operations. |
- Double-click on the ROI to:
- Change the ROI name
- Re-position the ROI by specifying XY coordinates of the top-left and bottom-right anchor points.
- Right-click on the ROI to:
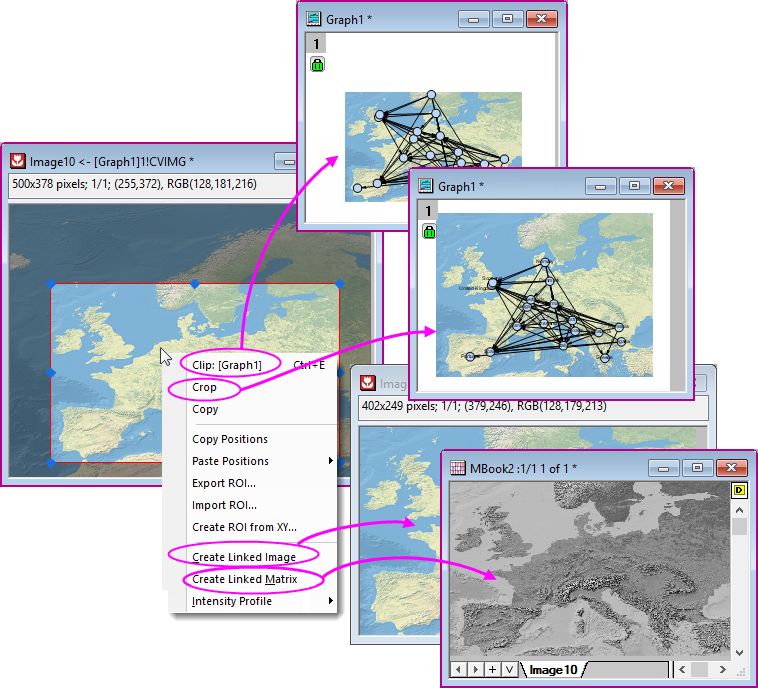
- Clip: Available when the image is opened from a graph (e.g. by double-clicking the graph image). This clips the graph image to the Image window ROI. The original graph image size is reduced to the size of the clipped region. To restore the full image in the graph window, right-click outside of the ROI and choose Remove Clipping.
- Crop: Crop Image window image and graph image (if exists) to the ROI. Graph image size and position are kept.
- Copy: Copy the ROI as an image. You can then paste it to other windows inside Origin, e.g. a graph or worksheet window, or to other applications. For multi-frame image, only the active frame is copied.
- Apply Scale to Graph: Available when the image is inserted into a graph by Image from Image Window. This updates the graph image to the Image window ROI.
- Copy Positions: Copy the ROI box coordinates of 4 vertices. You can choose to paste it as plain numbers, or, Paste Position to another ROI box. For the latter option, you can choose to paste only ROI Width/Height, or Horizontal/Vertical location.
- Export ROI: Saves details (e.g. ROI name, position of vertices, etc.) to a .ROI file and later.
- Import ROI: Applies details of a previously-saved ROI, to the selected ROI.
- Create New from XY: Create a new ROI box of arbitrary shape from a set of XY coordinates (boundary) and index data. See also Create ROI from XY in NetCDF data.
- Create Linked Image: Outputs the ROI to a new Image window. If you move ROI or adjust the ROI box size or shape, the new window will update accordingly.
- Create Linked Matrix: Outputs the data inside ROI to a new Matrix window. The matrix will update according to the Image window ROI.
- Intensity Profile: Perform intensity profile on ROI and output descriptive statistics value to a worksheet. See below section for details.
The degree of image darkening outside of the Image Window ROI is controlled by system variable @IMGDI. Setting @IMGDI = 1000 will cause the outside area to display as black; @IMGDI = 0 turns off darkening. For information on changing the value of a system variable, see this FAQ. |
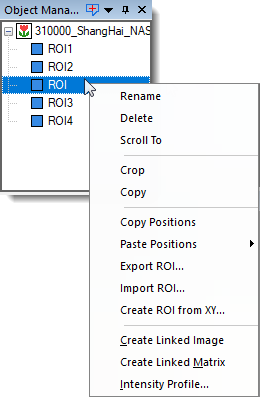
ROI in Object Manager
Besides the mini-toolbar and right-click menu, ROIs listed in the Object Manager (docked at the top-right corner by default) offer a set of menu items for daily tasks.
Most items also appear in the right-click menu, but one deserves special attention:
- Scroll To: centers the image on the selected ROI. If you zoom in the Image window (e.g., display in the actual size) and the ROI has scrolled out of view, this menu can bring it back instantly.
Intensity Profile on ROI
Right click on the ROI box and select Intensity Profile from context menu.
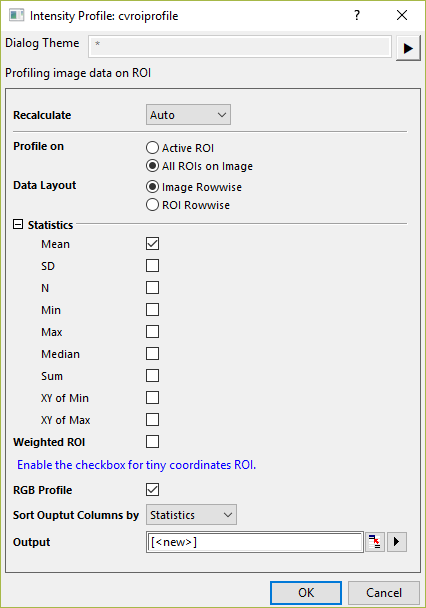
This will open the cvroiprofile dialog.
- You can choose to take profile on single ROI (Active ROI) or multiple ROIs (All ROIs on Image). If the Image window contains multi-frames, every frame's result will be output.
- Select the descriptive statistics value to output under Statistics branch: Mean, SD, Min, Max, Median, Sum, XY of Min and XY of Max.
- If Weighted ROI check box is selected, pixels on/near to the ROI border (ROI cannot fully corver one pixel) will be weighted by the percentage of area inside the ROI. This checkbox is usefaul when the ROI is tiny, in which case the edge pixels have a bigger effect on the whole ROI.
Refer to the X-Function cvroiprofile for more details.
Create Graph from Image
Plot Image as Background
- Select menu Image: Plot Image as Backgroound.
- This will create a new graph window and set the current image as its background.
- The created graph window will automatically set layer isometric (Plot Details > layer level > Size tab > Link Axis Length to Scale with X/Y RATIO = 1).
- The graph page is auto-rescaled to fit to layer size.
- If the Image's XY coordinaes change, e.g. the Image is a linked image created from a ROI box on another Image and the ROI is relocated, the graph will be rescaled accordingly. You can turn off this feature by clicking Auto Rescale Background Image button
 on the layer level mini-toolbar.

Learn more about inserting an image to a graph on this page.
Plot Menu
- Besides, image window supports following graph types from Plot menu:
- Statistcal: Histogram
- The histogram graph reflects the number of pixels at each level in the image.
- The bin data of the histogram can be accessed by clicking Go button under Bin Worksheet control group on the Data tab of Plot Details dialog.
- Contour: Contour - Color Fill, Gray Scale Map, Heatmap, Contour Profiles, Image Profiles, Image Plot, Image as Background (same as Image: Plot Image as Background menu mentioned above)
- 3D: 3D Colormap Surface, Surface with Projection
- Statistcal: Histogram
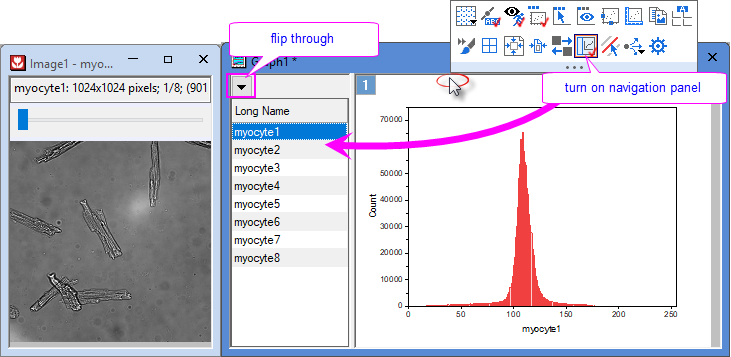
- If plot following graph types from a multi-frame Image window,
Histogram, Contour - Color Fill, Gray Scale Map, Heatmap, Contour Profiles, Image Profiles,
Browser Graph will be created.- You can click Column Switching Browser Graph button
 from page level mini toolbar to open the navigation panel.
 - Select Flip Through context menu to view through frames by step(s) you specified.
- Click the hyperlink of each graph type for detailed information.
- You can click Column Switching Browser Graph button
- If you save a customized graph as a template, you can plot it from menu Plot: User Temlates.
Adjustments and Conversion
Besides buttons and menus mentioned above, Origin provides a sets of tools useful in image processing and analysis. They are sub-categorized as follow:
Converting to Matrix and Reversion
As different ways of dataset display and storage, sometimes you need to convert betwenn Image window and Matrix window. Data type can be specified during the conversion, which should take in account when the post-processing has a requirement on the data type.
Convert an image (single chanel) into matrix,
- Select menu Image: Convert to Matrix to open the Cv2Mat dialog.
Following data types are supported:
| !Auto | This is the default option. It will take image types and generate one matrix object per image frame always: 8bit gray-scale image will be converted to Byte matrix, and RGB color image to UInt matrix.
Note that it will not handle Alpha Channel and you can pre-preprocess it if needed. |
|---|---|
| Byte | Byte matrix: Values frome 0 to 255 |
| UShort | Unsigned short matrix: values from 0 to 65535 |
| 'UInt | Unsigned Int matrix: values from 0 to 4294967295 |
| Float | 32bit Float matrix: values from -3.4X1038 ~ 3.4X1038 |
| Double | 64bit Float matrix: values from -1.7X10308 to 1.7X10308 |
Convert a matrix to image window,
- You can do it in Python. Below is a sample.
import originpro as op
import numpy as np
ml = op.find_sheet('m')
a = ml.to_np3d()
iw=op.new_image()
iw.setup(1,True)
iw.from_np(a)
iw.set_int('NAV',1)