31.9.10 Interval Plot
| |
|
|
|
Data Requirements
Select one or more columns or a range of data from at least one column.
Creating the Graph
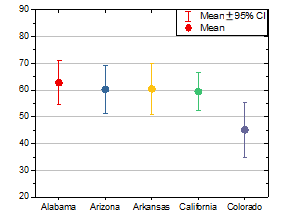
Interval Plot
- Select the data and:
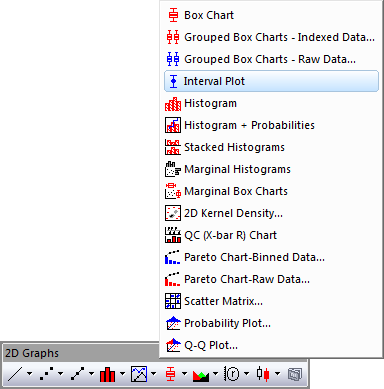
- From Origin menu, select Plot > Statistical: Interval Plot
- OR
- Click the Interval Plot button in the 2D Graphs toolbar:
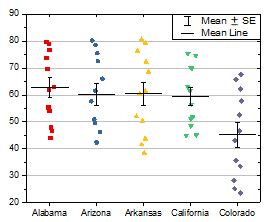
Scatter Interval
- Select the data
- From Origin menu, select Plot: 2D: Box: Scatter Interval
Template
Interval Plot: BoxInterval.otp
Scatter Interval: ScatterInterval.otp
Both templates are installed to the Origin program folder.
Notes
In fact, the interval plot is a box chart whose box type is set to Box, box style is set to No Box and Percentile Type only checks Mean checkbox with symbol specified as solid circle.
In order to create grouped interval plot, you can create a grouped box chart with indexed data or raw data first and select Box_Interval Plot from Graph Theme drop-down list.
The scatter interval plot can be created from interval plot by the following steps:
- Set Type to Box + Data Overlap on the Box tab of Plot Details dialog, and set Whisker: Range to SE, Coef to 1
- Select Jitter Points on the Data tab.
- Selecting Mean Line on the Line tab.
- Uncheck Mean on the Percentile tab.