Beginning with Origin 2022b, you can insert images from file, a Web URL or from a worksheet cell.
You can insert images from an image file or a Web URL, into a text object. In either case, images are linked rather than embedded, which means that (a) project size is kept to a minimum and (b) if/when images are changed, the inserted image is also updated.
To examine (or modify) the syntax used for inserting an image, you can select the inserted object and choose Properties. In the Text Object dialog, you should see something like these examples:
Examples:
\img(file://"C:/Program Files/OriginLab/Origin2022b/Samples/Image Processing and Analysis/white camellia.jpg",w=200)
\img(https://www.originlab.com/images/header_logo.png, w=200)
... where option "w=" is the default width in pixels, of the inserted image. Width is user-modifiable by editing the "w=" value in Properties or -- if no width is specified -- by simply dragging the object's selection handles.
\img(Graph1)or
\img([book1]sheet1)to insert Graph or Worksheet table.
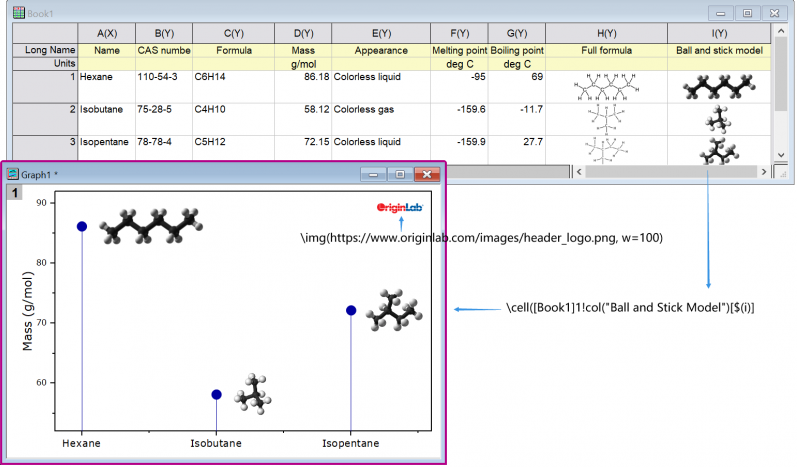
You can also insert an image from a worksheet cell into a text object, but as there is no menu option for adding, you'll need to make use of a special syntax. The syntax is not complicated and combines a \cell( ) escape sequence with a cell reference -- either a range reference (e.g. [Book1]Sheet1!col(C)[1]) or a named range reference.
\cell([Book1]Sheet1!B[1])), click outside the text object to leave edit mode. Your cell image should display in the text object.\cell([Book1]Sheet1!B[1])) and when finished, right-click on the object, choose Properties and on the Text tab, remove one of the leading "\" characters from your cell reference (Origin automatically "protects" "\" characters entered into text objects which is why you'll need to remove one "\". See Escape Sequences).\cell([Book1]Sheet1!B[1])) directly to display the cell image.
Examples:
\cell([Book1]1!col(C)[2]) // Book1, Sheet1, col C, row2, size = current font height
\cell(alpha,200) // named range "alpha", width=200 logical pixels
\cell(alpha,h=300) // named range "alpha", height=300 logical pixels