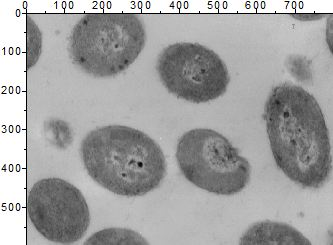
29.19.3 Image Plot
Image-Plot
Data Requirements
- Matrix: a matrix of Z values. The data may have originated from a raster image. Multi-object sheet is supported.
or
- Image: An Image window. Multi-frame image is supported. Refer to this page below to see how to flip through all frames.
Creating the Graph
Activate a matrix or image window.
From the menu, choose .
or
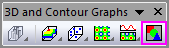
Click the Image Plot button on the 3D and Contour Graphs toolbar.
Template
IMAGE.OTP (installed to the Origin program folder).
Notes
- The default X and Y axis range is determined by the coordinate range of the matrix, which in an image, is the X and Y pixel range. The menu will display the X and Y values in the matrix.
- In image plots of matrix data (e.g. an image plot of geographic data), layer size is a function of the ratio between Xmax - Xmin and Ymax - Ymin and the layer's Link Axis Length to Scale with X:Y Ratio option is set to 1, by default.