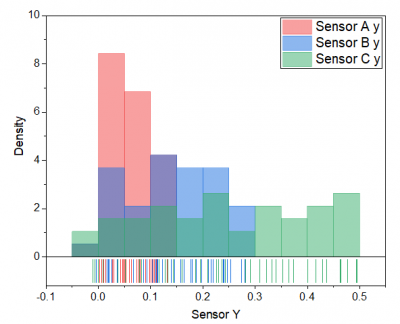
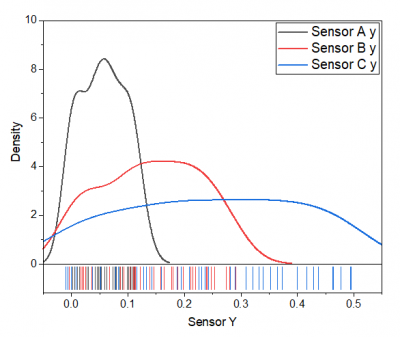
31.9.9 Histogram + Rug/Distribution + Rug Graph
| |
|
|
|
Data Requirements
Select one or more columns (or a range from one or more columns).
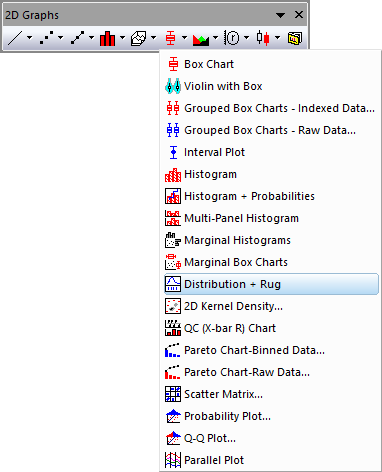
Creating the Graph
- Select required data.
- From the menu, select .
- for Distribution + Rug graph, you can also
- Click the Distribution + Rgu button on the 2D Graphs toolbar.
Template
Histogram + Rug: HistogramRug.otp (installed to the Origin program folder.) Distribution + Rug: DensityRug.otp (installed to the Origin program folder.)
Notes
- The basic idea of rug is that project the data points onto an axes and represent it as thin lines beside the axes.
- This rug representation is not a density plot, it just projects each point to the axes with a thin line. Thus, there is not bandwidth in the rug representation.
- If the X/Y direction has duplicate values, the rug lines will be overlapped.
- You can double-click on the rug panel to open the Rug tab of Axis dialog to check the detailed settings for this kind of graphs.